
Attendance: now with more winning!
Part-two of last week's post

Sometimes data points out the obvious. You know, the “scientists confirm ice cream is good” headline. And sometimes data reveals something surprising or pushes against conventional wisdom, “scientists report ice cream is good and good for you.” Usually, though, I find the value of looking at basketball data is some mix of the two. Kind of like this, which points out something obvious, but also something that I hadn’t really noticed before:

In last week’s post, I showed what most Wizards fans know: attendance is down this season compared to previous years. I noted that attendance has actually been on the decline since the 2017-2018 season. I also looked at potential explanations based on the data I scraped. Then I sent my write-up out into the world. The world provided some feedback.
One obvious, but missing, part of the last post was some measure of overall team quality. I included a variable on the team’s win-loss streak, but this didn’t really correlate with game-to-game attendance. This kind of makes sense if you take into account the main finding of the last post: the opposing team is one of the key drivers of attendance. So, if we look at say, the 2014-2015 season, the Wizards had a terrible February. They lost all but three of their 12 games that month, including a rough stretch after the All Star game. Still, four of their six home games were sold out,1 while the other two, non-sold out home games were against Charlotte and Orlando, who were about as good as you’d expect.
In a CNBC story from a few years ago, StubHub’s communication director, Cameron Papp, describes this situation as, “the Lebron James effect:”2
Winning by itself is not enough to bring fans to the arena. NBA ticket sales and attendance for some franchises are heavily influenced by the market and marquee players, according to ticket sales site StubHub.
[…]
“Anytime he [Lebron James] comes to an opposing team’s area, sales boost by usually 15 percent,” Papp said.
While this seems obvious—people want to see stars when they come to DC—it doesn’t completely explain why average attendance has increased and declined over the past 10 seasons as I highlighted in the last post.
Winning and fans in seats
In my previous analysis I fell back on 538’s quality measure, which is, “the harmonic mean of the teams’ Elo ratings,” or essentially the game-based average of their team-based rating for the Wizards against whatever opponent. This measure wasn’t strongly correlated with attendance. As I noted in the previous post, none of the in-game box score stats were predictive of fans in seats either.
Game-to-game quality or streakiness didn’t strongly predict attendance in my model and also doesn’t get at the thing that I tried to capture in my anecdote about Downtown Locker Room—the team just hasn’t been good for a long time and so a lot of people stay home.
To capture this on a game-to-game level, I calculated the rolling win percentage based on my previous data set of game logs and attendance. This is just the number wins divided by the total number of games at each game in the season. For example, if a team plays 10 games and wins three of them, their win percentage at that point in the season would be .300. The Wizards finished the 2016-2017 season with 49 wins, or a .597 win percentage. But, they had a rocky start that year. Here’s what this looks like for game-by-game win percentage.
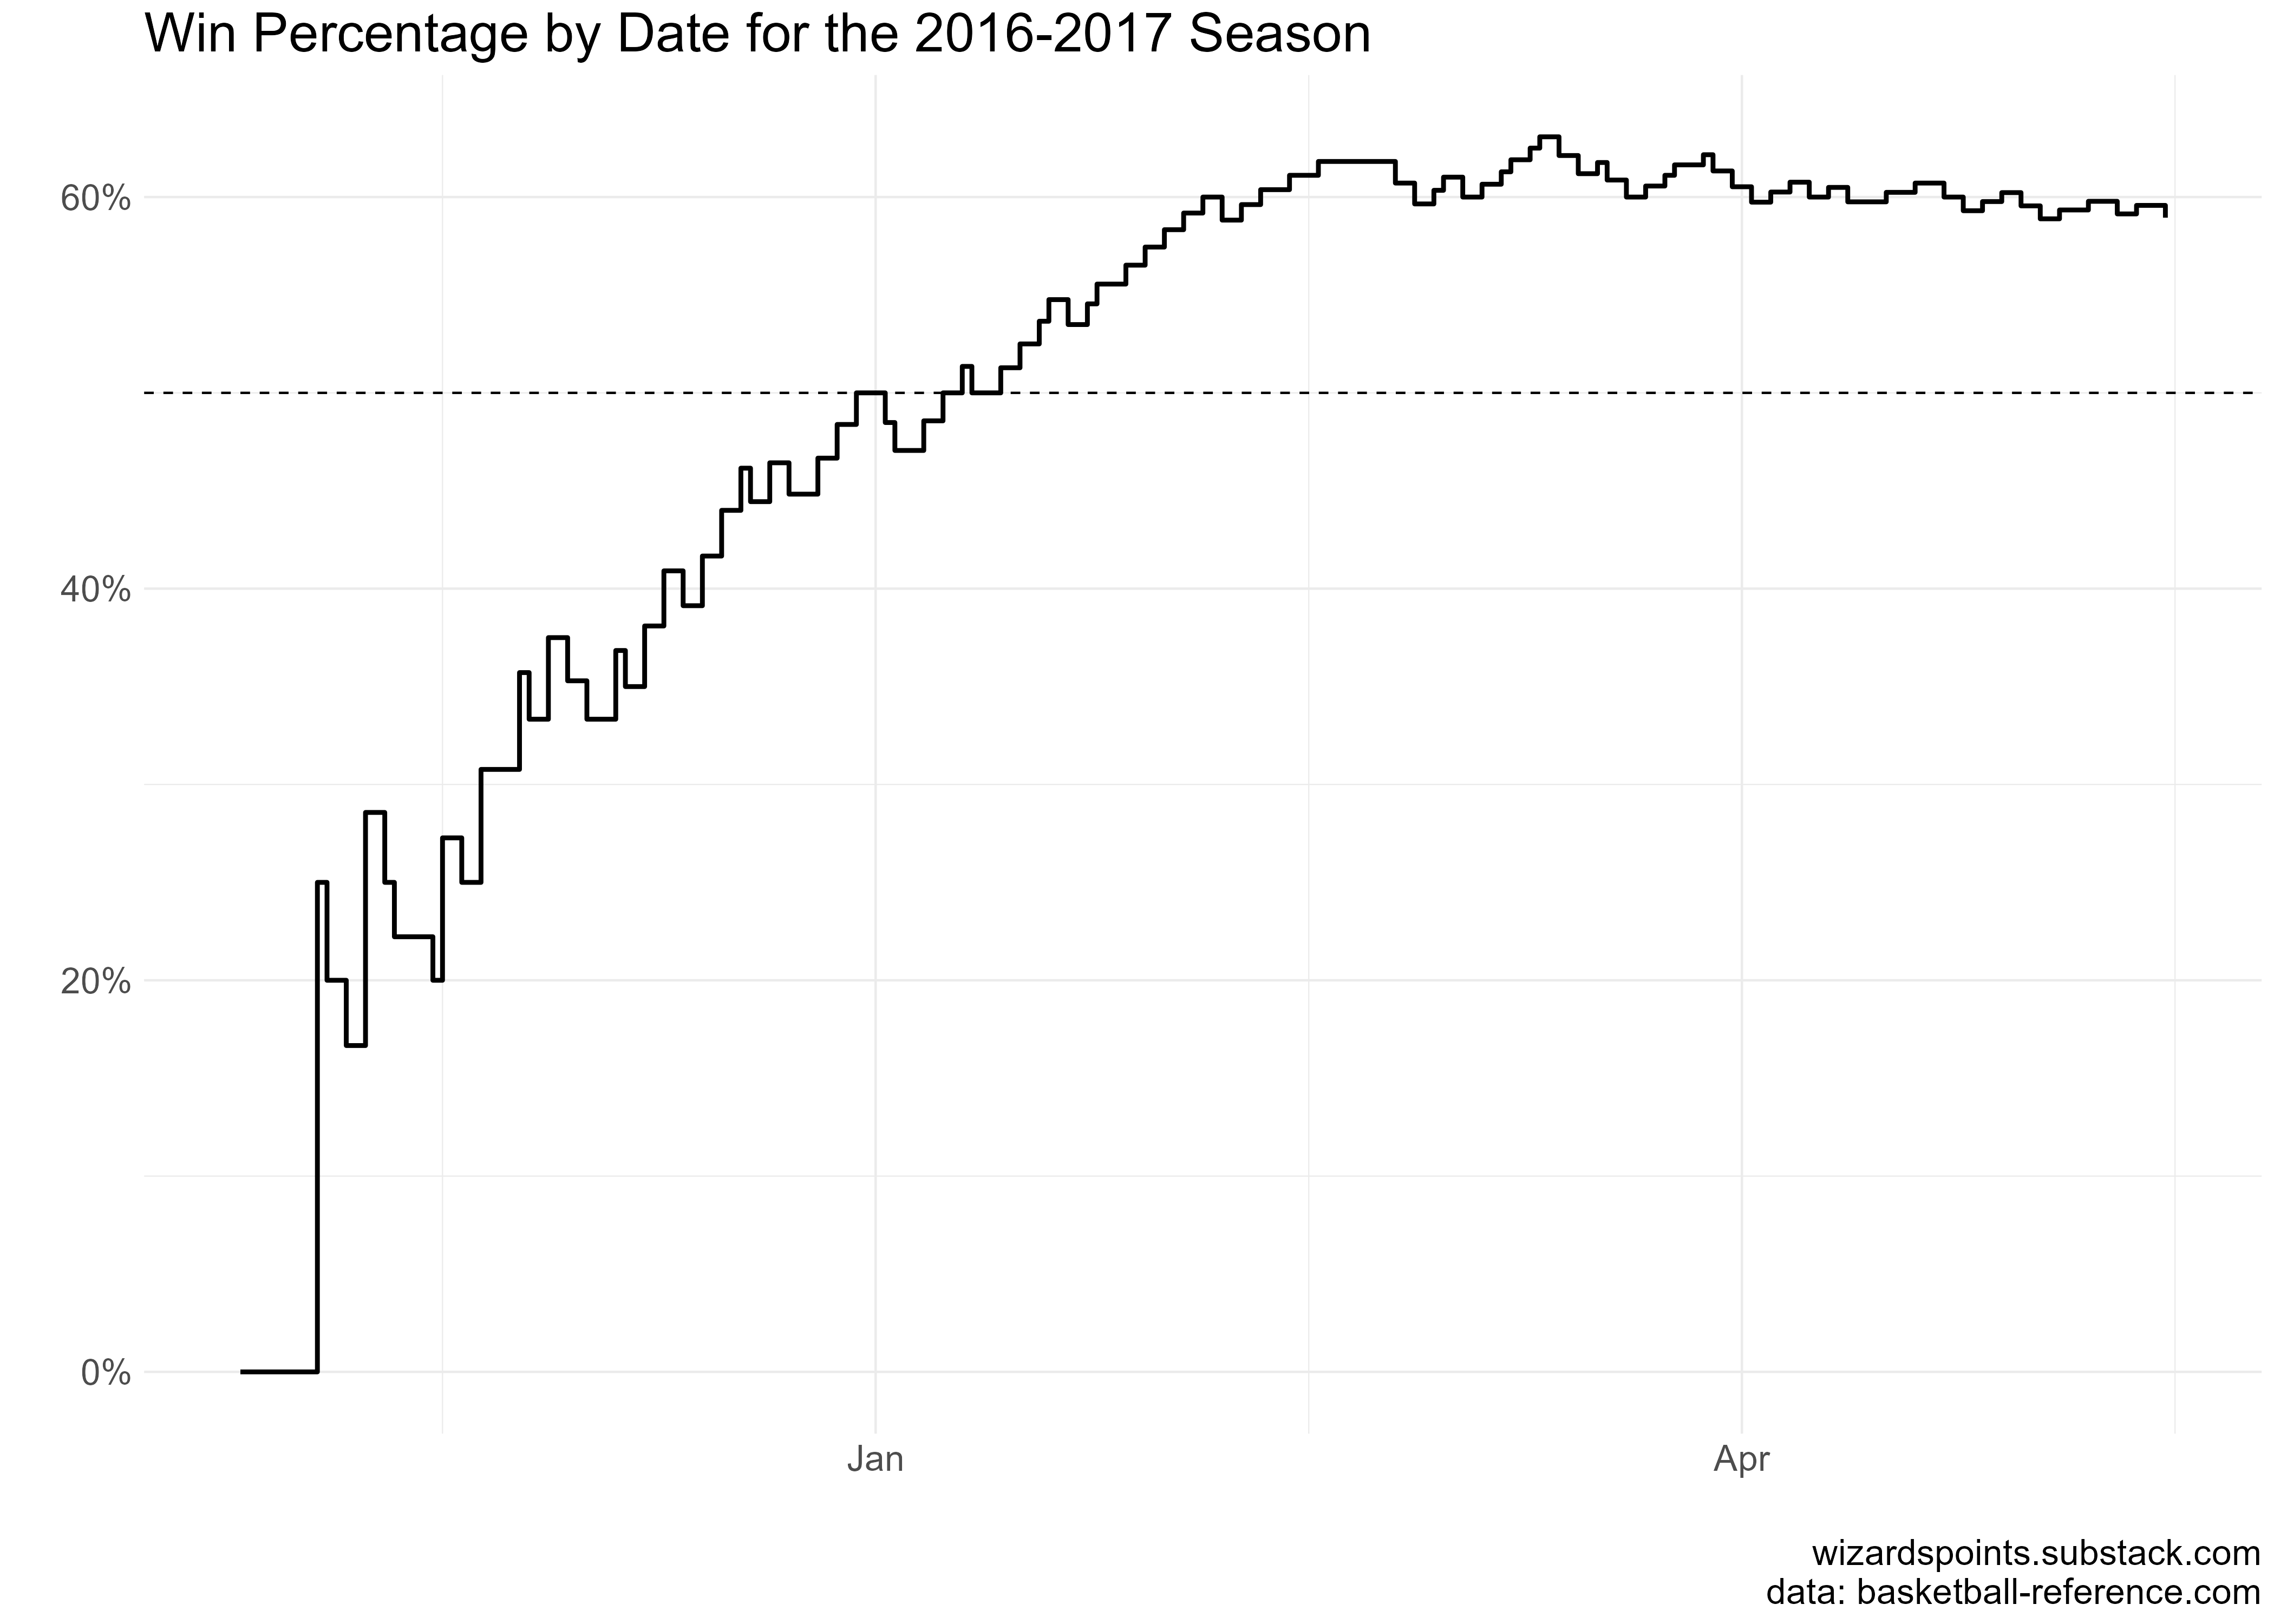
The Wizards, like all of us, win some and lose some. This isn’t notable. The rolling win percentage just helps capture this in a more nuanced way than I used in my last post, which only considered streaks and a few 538 variables to measure quality. The key question is whether win percentage and attendance have any relationship.
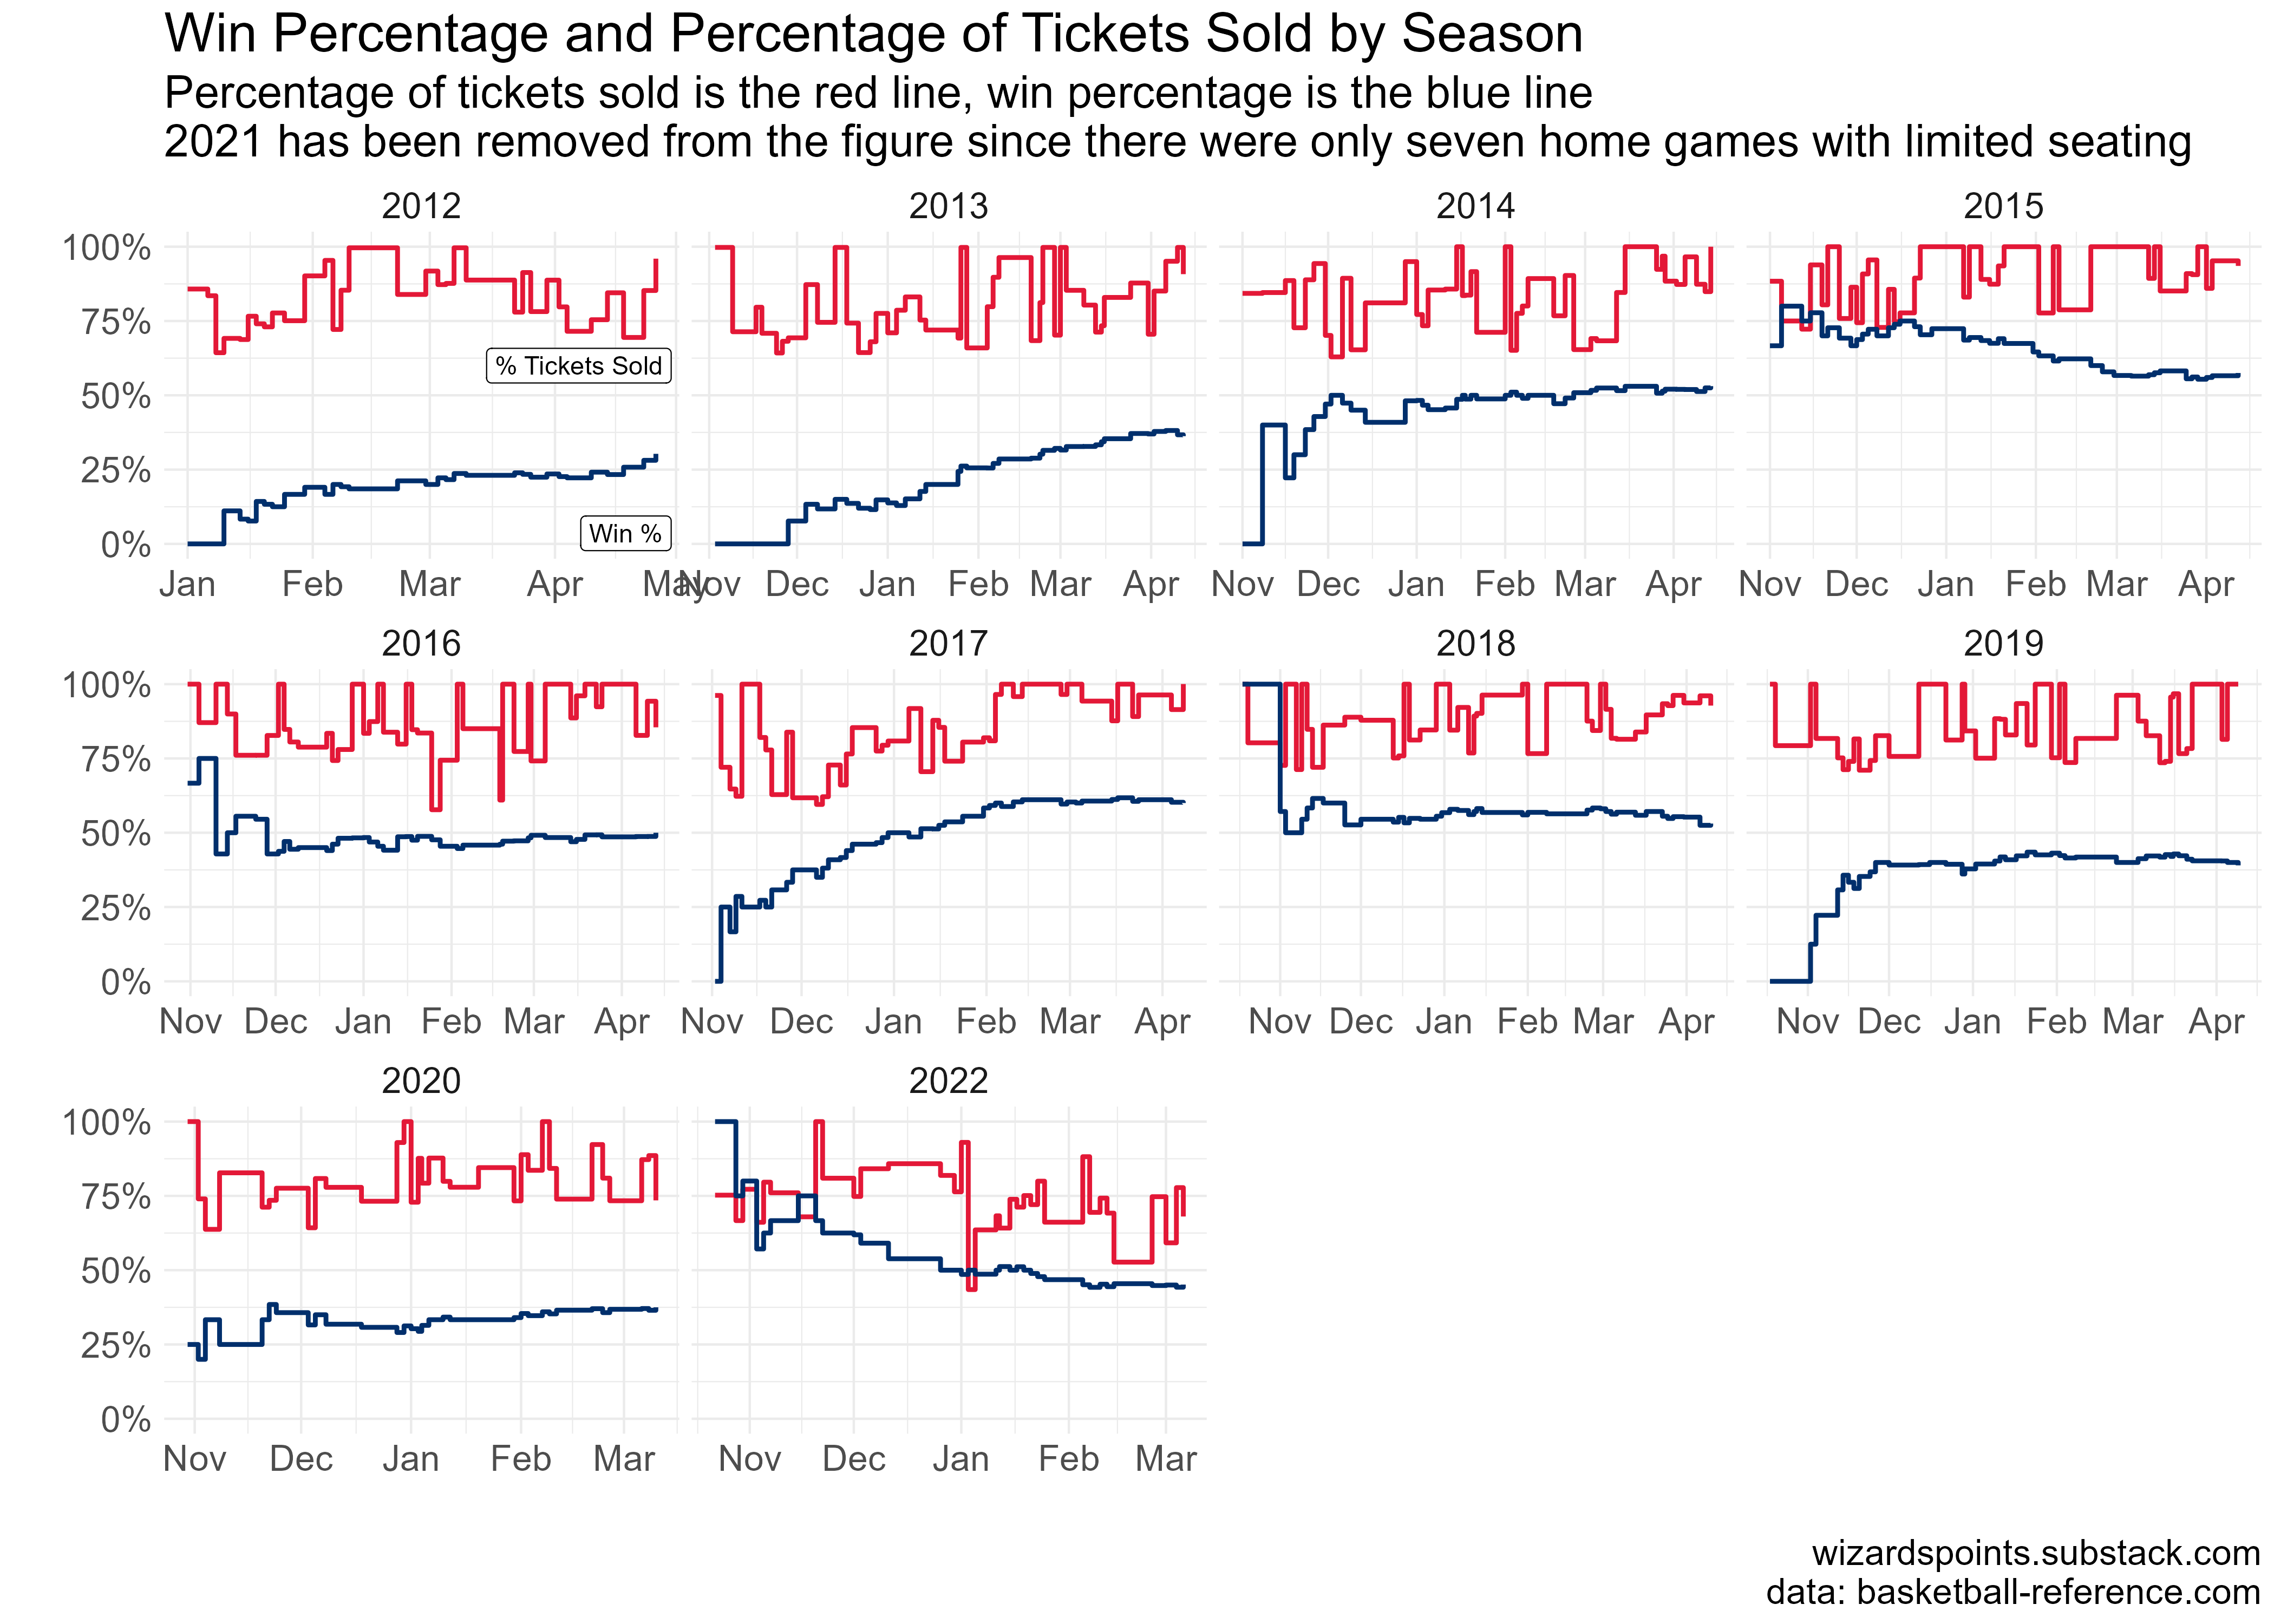
The percentage of the arena that is sold out varies a lot over a season, but the Wizards tend to settle into their overall win percentage by February. This season stands out for having some pretty low lows as far as attendance, with only 8,902 fans, or about 43% of seats filled, at the January 3rd game win against Charlotte. As I mentioned in the last post, a lot of this is likely the effect of Covid-19, there’s no doubt, but the day of the week (that game was on the Monday after New Years) is also important season after season.
Winning matters. As a Wizards fan, I’ll take every W the team can get. I don’t have any expectations of a championship any time soon. But I still want my team to win and the other team to lose. If I lived in some other city, had grown up somewhere else, or had parents who were die hard Whatevers fans, I would probably feel the same way about some other team (of course this will always make a strong case for DC).
Winning also matters for attendance, too. At least to some extent. The overall correlation coefficient is about 0.2, which is not super strong. In the top figure below, you can see this positive relationship, but also how much noise there is, with lots of dots above and below the line. Adding in win percentage to my model from last post to account for some of the variation due to opponent, season, and month effects, a one percentage point increase in win percentage is associated with between a three and 28 percent increase in attendance.3 This is a pretty wide range, with a lot of uncertainty, but it points to the fact that the positive relationship between winning and fans is there, it’s just tough to pin down. What it essentially means is that winning does matter for attendance, but there’s a lot of variation in how much it matters.
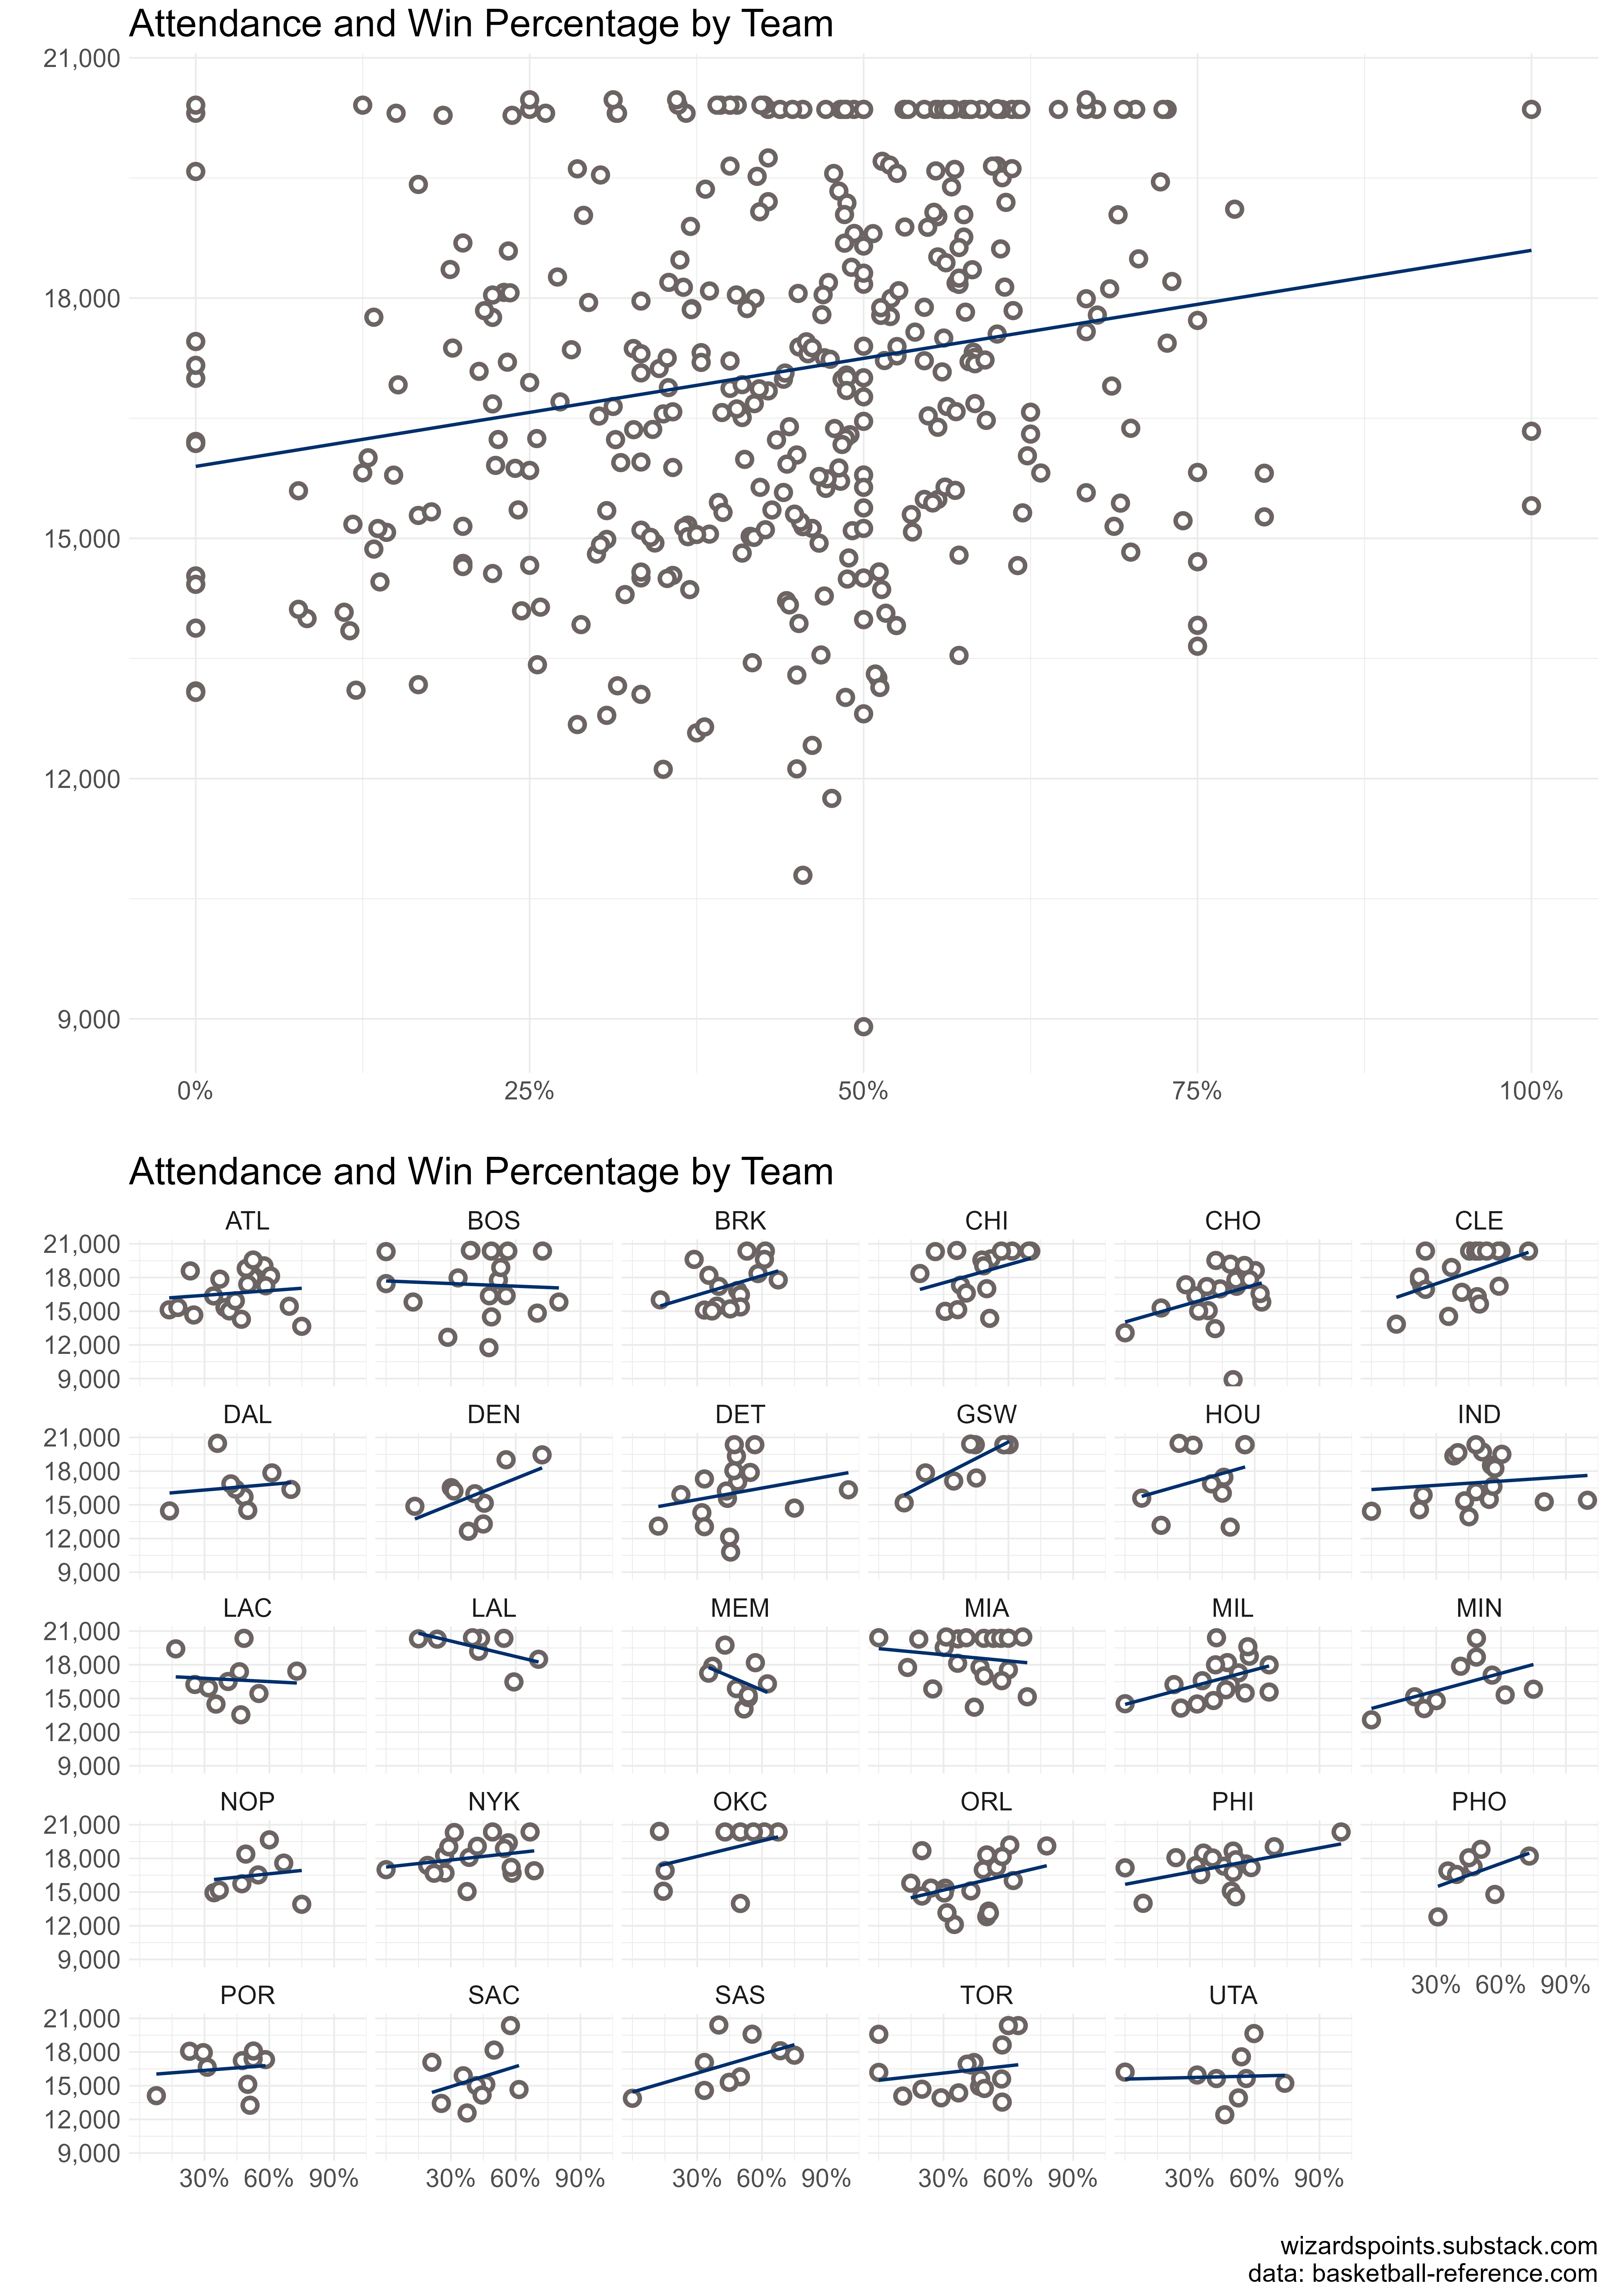
I’ve tried to simplify things with the figure above. You can see that for some teams like Atlanta, Boston, the Knicks, Miami, and the Clippers, win percentage really doesn’t matter (straight or slightly angled lines). For others, like the Golden State, more people go to the already popular match-up when the Wizards are doing better (especially since 2014). Then there are teams people tend to skip as the Wizards get better. I don’t really know what is going on here, but I’m looking at Memphis and the Lakers. The Lakers actually average very high attendance (19,485 per game) overall, regardless of how the Wizards are doing. There was one game in 2017, though, with notably few fans. The Lakers showed up and started past-his-prime Luol Deng, a young D’Angelo Russell, Tarik Black, former Wiz kid Nick Young, and Timofey Mozgov. Not exactly the stuff of an HBO series.
I have written before that any given statistic in isolation isn’t always informative. Basketball isn’t interesting because of analytics, but data can help highlight the trends that might be tough to explain otherwise. Data can highlight the “homeowner” in a sea of “meows.” I wanted to re-visit a better measure of team performance to see the effect of attendance. Winning matters, but it isn’t the only thing that matters. This seems to be the story in the data and also for anyone still going to games. Watching live NBA basketball can be special. Even the worst games have their moments. You get to to hear players drop f-bombs, watch them on the bench and away from the action, and see the team interact with fans. Watching guys whose game you’ve seen develop over time is part of the fun. There are things that are aren’t always easy to see on tv, like off ball movement, in-play communication, and body language. Even in games that “don’t matter,” there really is nothing like sharing the dagger three-pointer or last minute shot with a bunch of cheering strangers. The data speak to the fact that winning helps push attendance, which seems obvious, but there’s a lot more to going to games than getting a W.
These were against Brooklyn, Cleveland, Golden State, and Detroit.
It’s worth noting that there is a lot of academic research on this subject. Do a Google scholar search and you’ll find a lot of papers looking at the impact of having a star on your team. People also tend to include things like metro area population, local GDP, and value of the franchise in their analysis. This post and my previous post are purely exploratory to see what might explain some of the variation in attendance, but if anyone is doing a dissertation on this, please reach out!
This is the 95% CI, so I’m simplifying things a bit. Depending on model specification, the average effect of winning after controlling for in-game box score stats, day of the week, the previously mentioned fixed effects and 538 stats is between 14-16 percent on average. Code and model checks are here.