
How much does the bench matter?
A Wizards Points exploration


The NBA bench is a notable outlier amid all of the glamour, money, and speed of professional basketball. Starters, with their on-court action, elite play, and eye popping contracts, get most of the attention. Starters tend to be generally athletic, generally talented, generally old enough to rent a car but too young to have had a Blockbuster card. The bench, though, is like a hospital: a mix of the very young, the very old, and people with knee issues. NBA benches are the opposite of why people tune in. Players are literally sitting around, often in sweatpants, doing the same thing as fans: watching their team play.
One of my favorite moments of every NBA playoffs is when some bench player goes off and drops 20 points to save their team. One of my least favorite moments as a Wizards fan is when some bench player, who has never scored more than 10 points, has a career night and drops 30+ points in DC during the depths of winter just when I’ve come up with a new argument to myself for why the Wiz could really, finally turn things around.
But how much does the bench matter? My general sense watching the NBA Finals and waiting patiently (/yelling at my TV) for former Wizards hero Ish Smith to get some minutes, is that bench minutes aren’t that important when you have really great players. And yet, 82 games is a lot. My other general feeling is that good teams often have at least average benches. You almost need to have decent back-ups to let your stars rest in order to survive the season and playoffs. Plus, if you’ve ever watched the Wizards give up a comfortable 12 point lead in five minutes of bench play, the impact of a bad bench is clear. So what do the data say?
Taking a look at bench and starter performance
Corey Kispert started 45 games last season. Deni Avdija started in 40 games. Daniel Gafford went 31 games coming off the bench and then played the other 49 games of his season as a starter.1 None of these guys were part of the “Big Three” of last season. When we think about bench vs. starter, reality is not quite so binary. Players go in and out of the starting line-up due to trades, injuries, or because the coach wants to make a statement.
To understand bench performance, we looked at data for all of the minutes each player played as either a starter (i.e., when they were in the starting line-up at the beginning of a game) or coming off the bench.2 This is a bit different than some stats that simply label a player either a starter or a bench player. As an example, Corey Kispert had a true shooting percentage (i.e., how many threes, twos, and foul shots did he hit given how many he attempted) at 74.3% coming off the bench compared to 62% true shooting as a starter. We can then aggregate this up across the league to see how bench minute performance (as measured by net rating, i.e., offensive rating minus defensive rating) compares to starting minute performance as shown in the figure below.
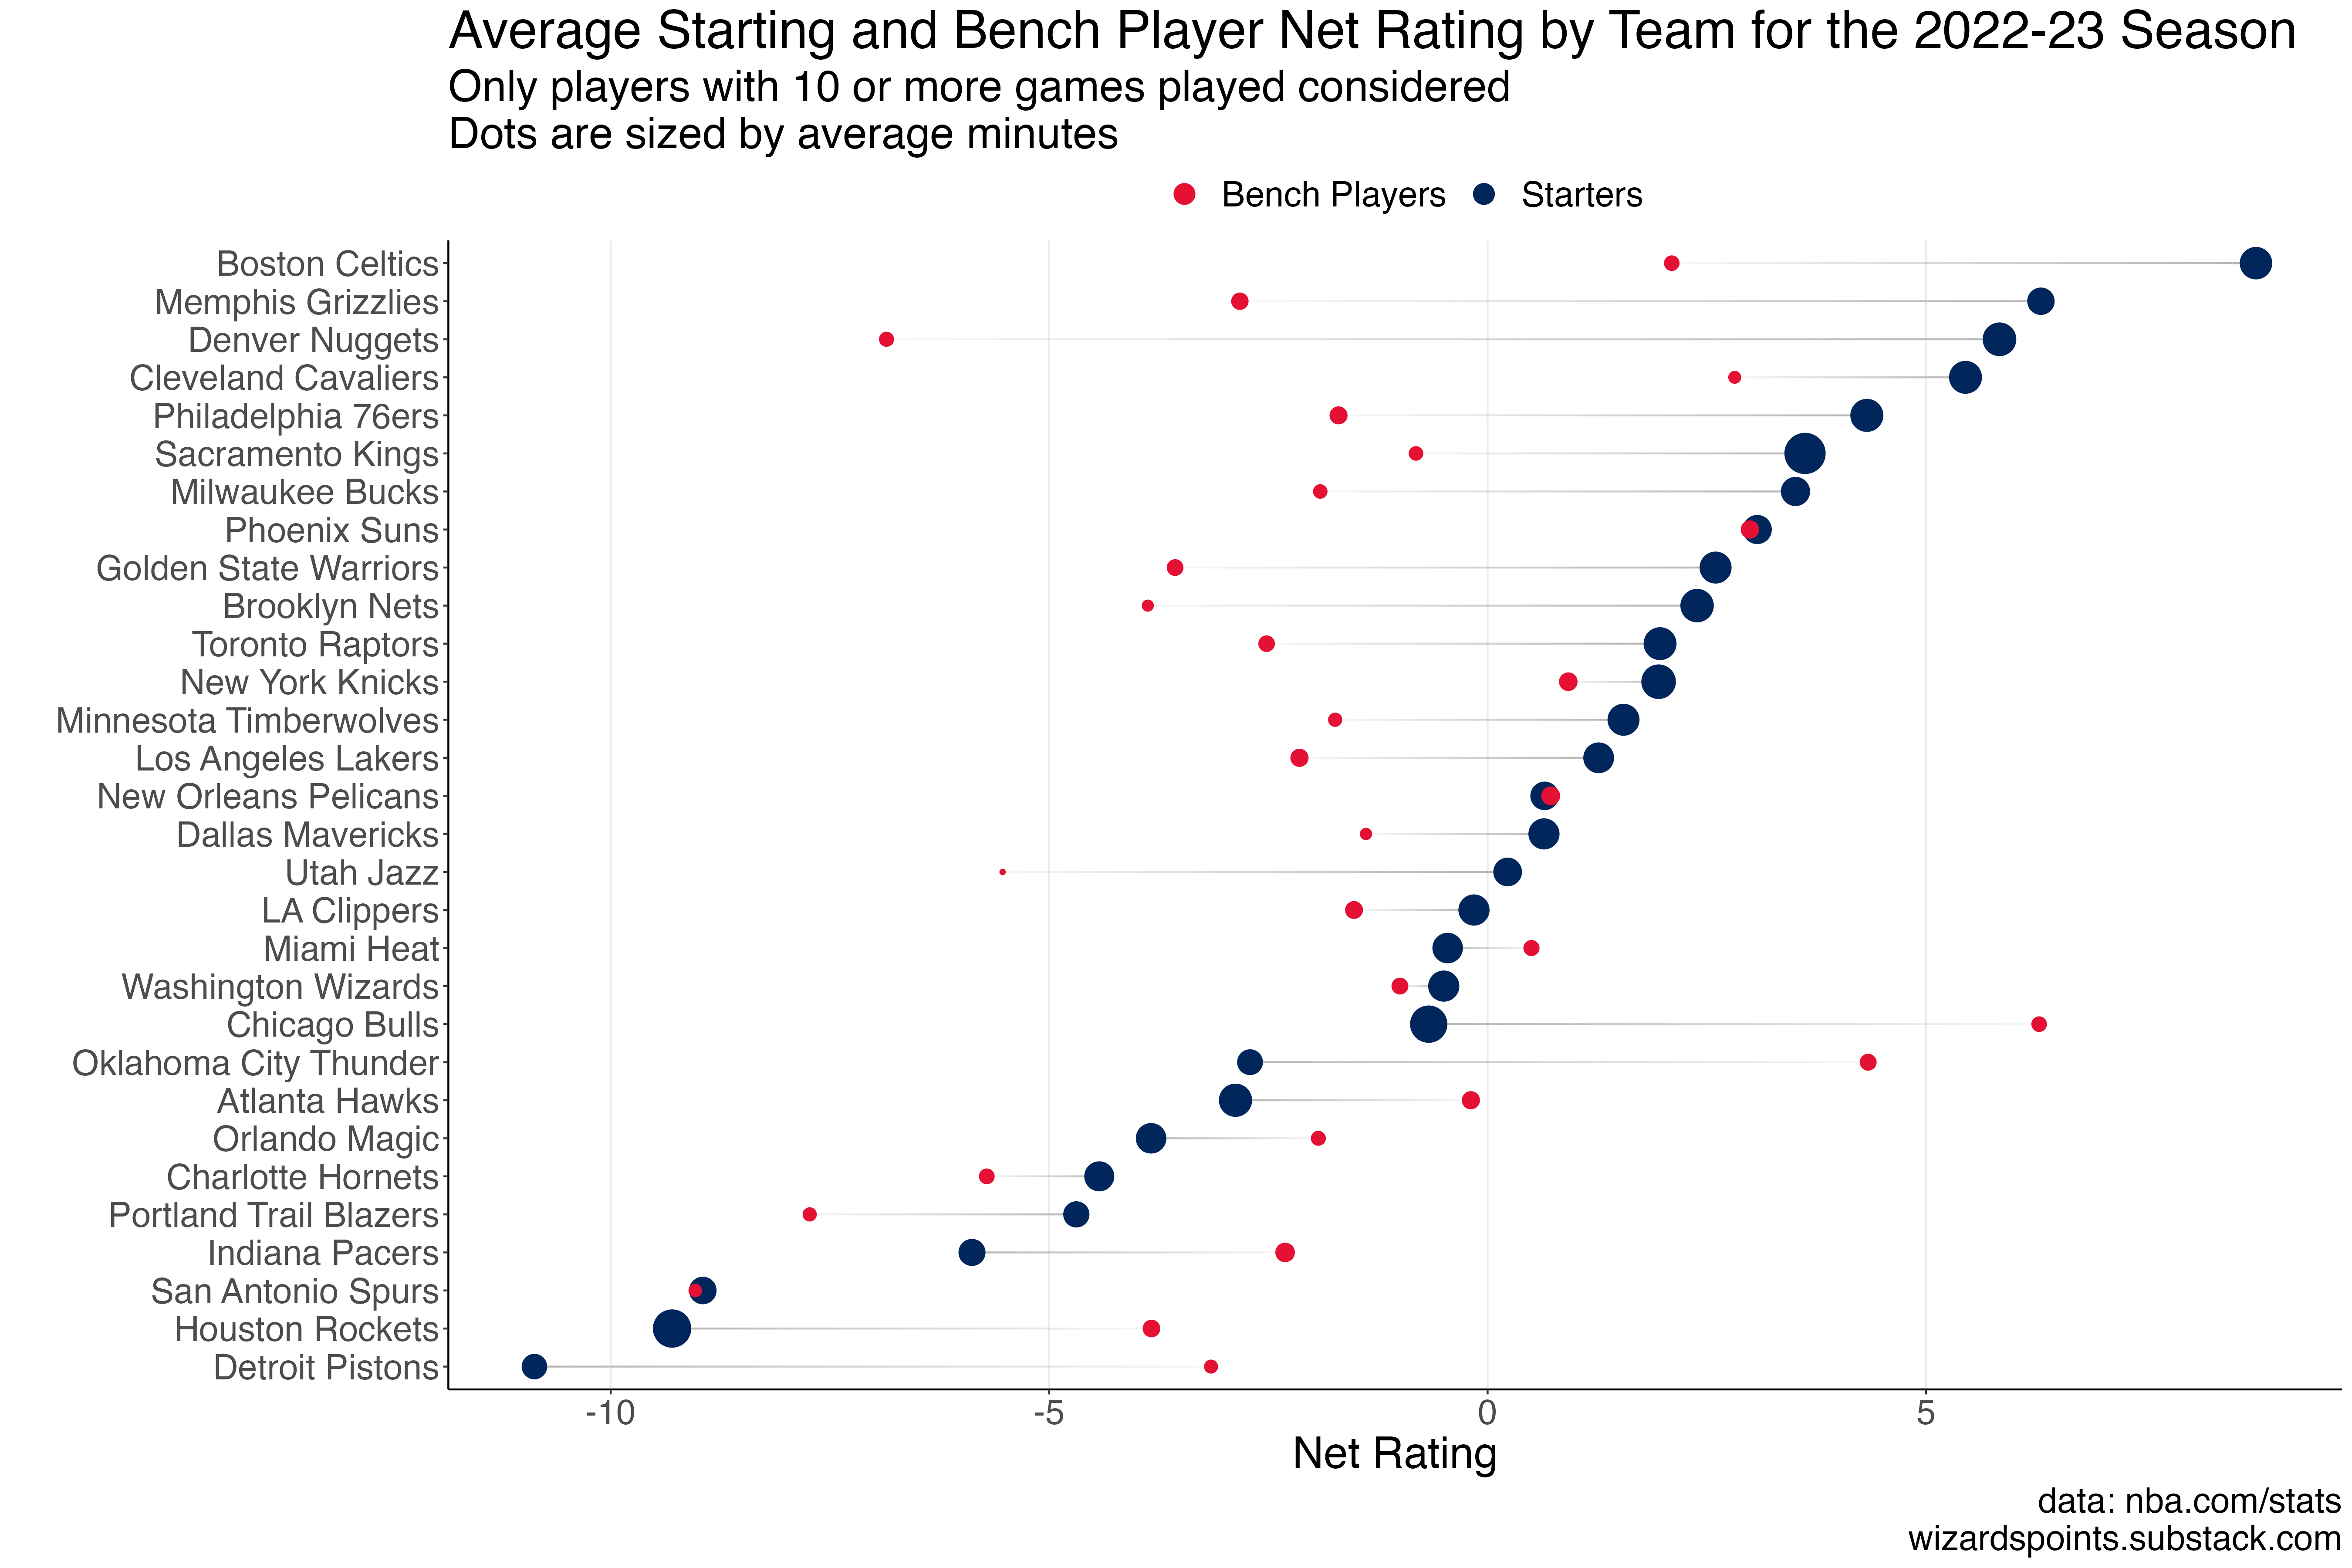
We can see that the gap between starter performance and bench performance is pretty wide for some really good teams (e.g., the Nuggets, Celtics). Notably, rebuilding teams seemed to have benches that out performed their starters on average (e.g., the Thunder, Pacers). And then we have the Wizards. While the gap between the Heat’s bench and starters is small (with the Heat bench actually having a higher average net rating than the starters for the regular season), the difference between the Wizards starters average net rating (-0.5 and the bench -1) is barely perceptible.
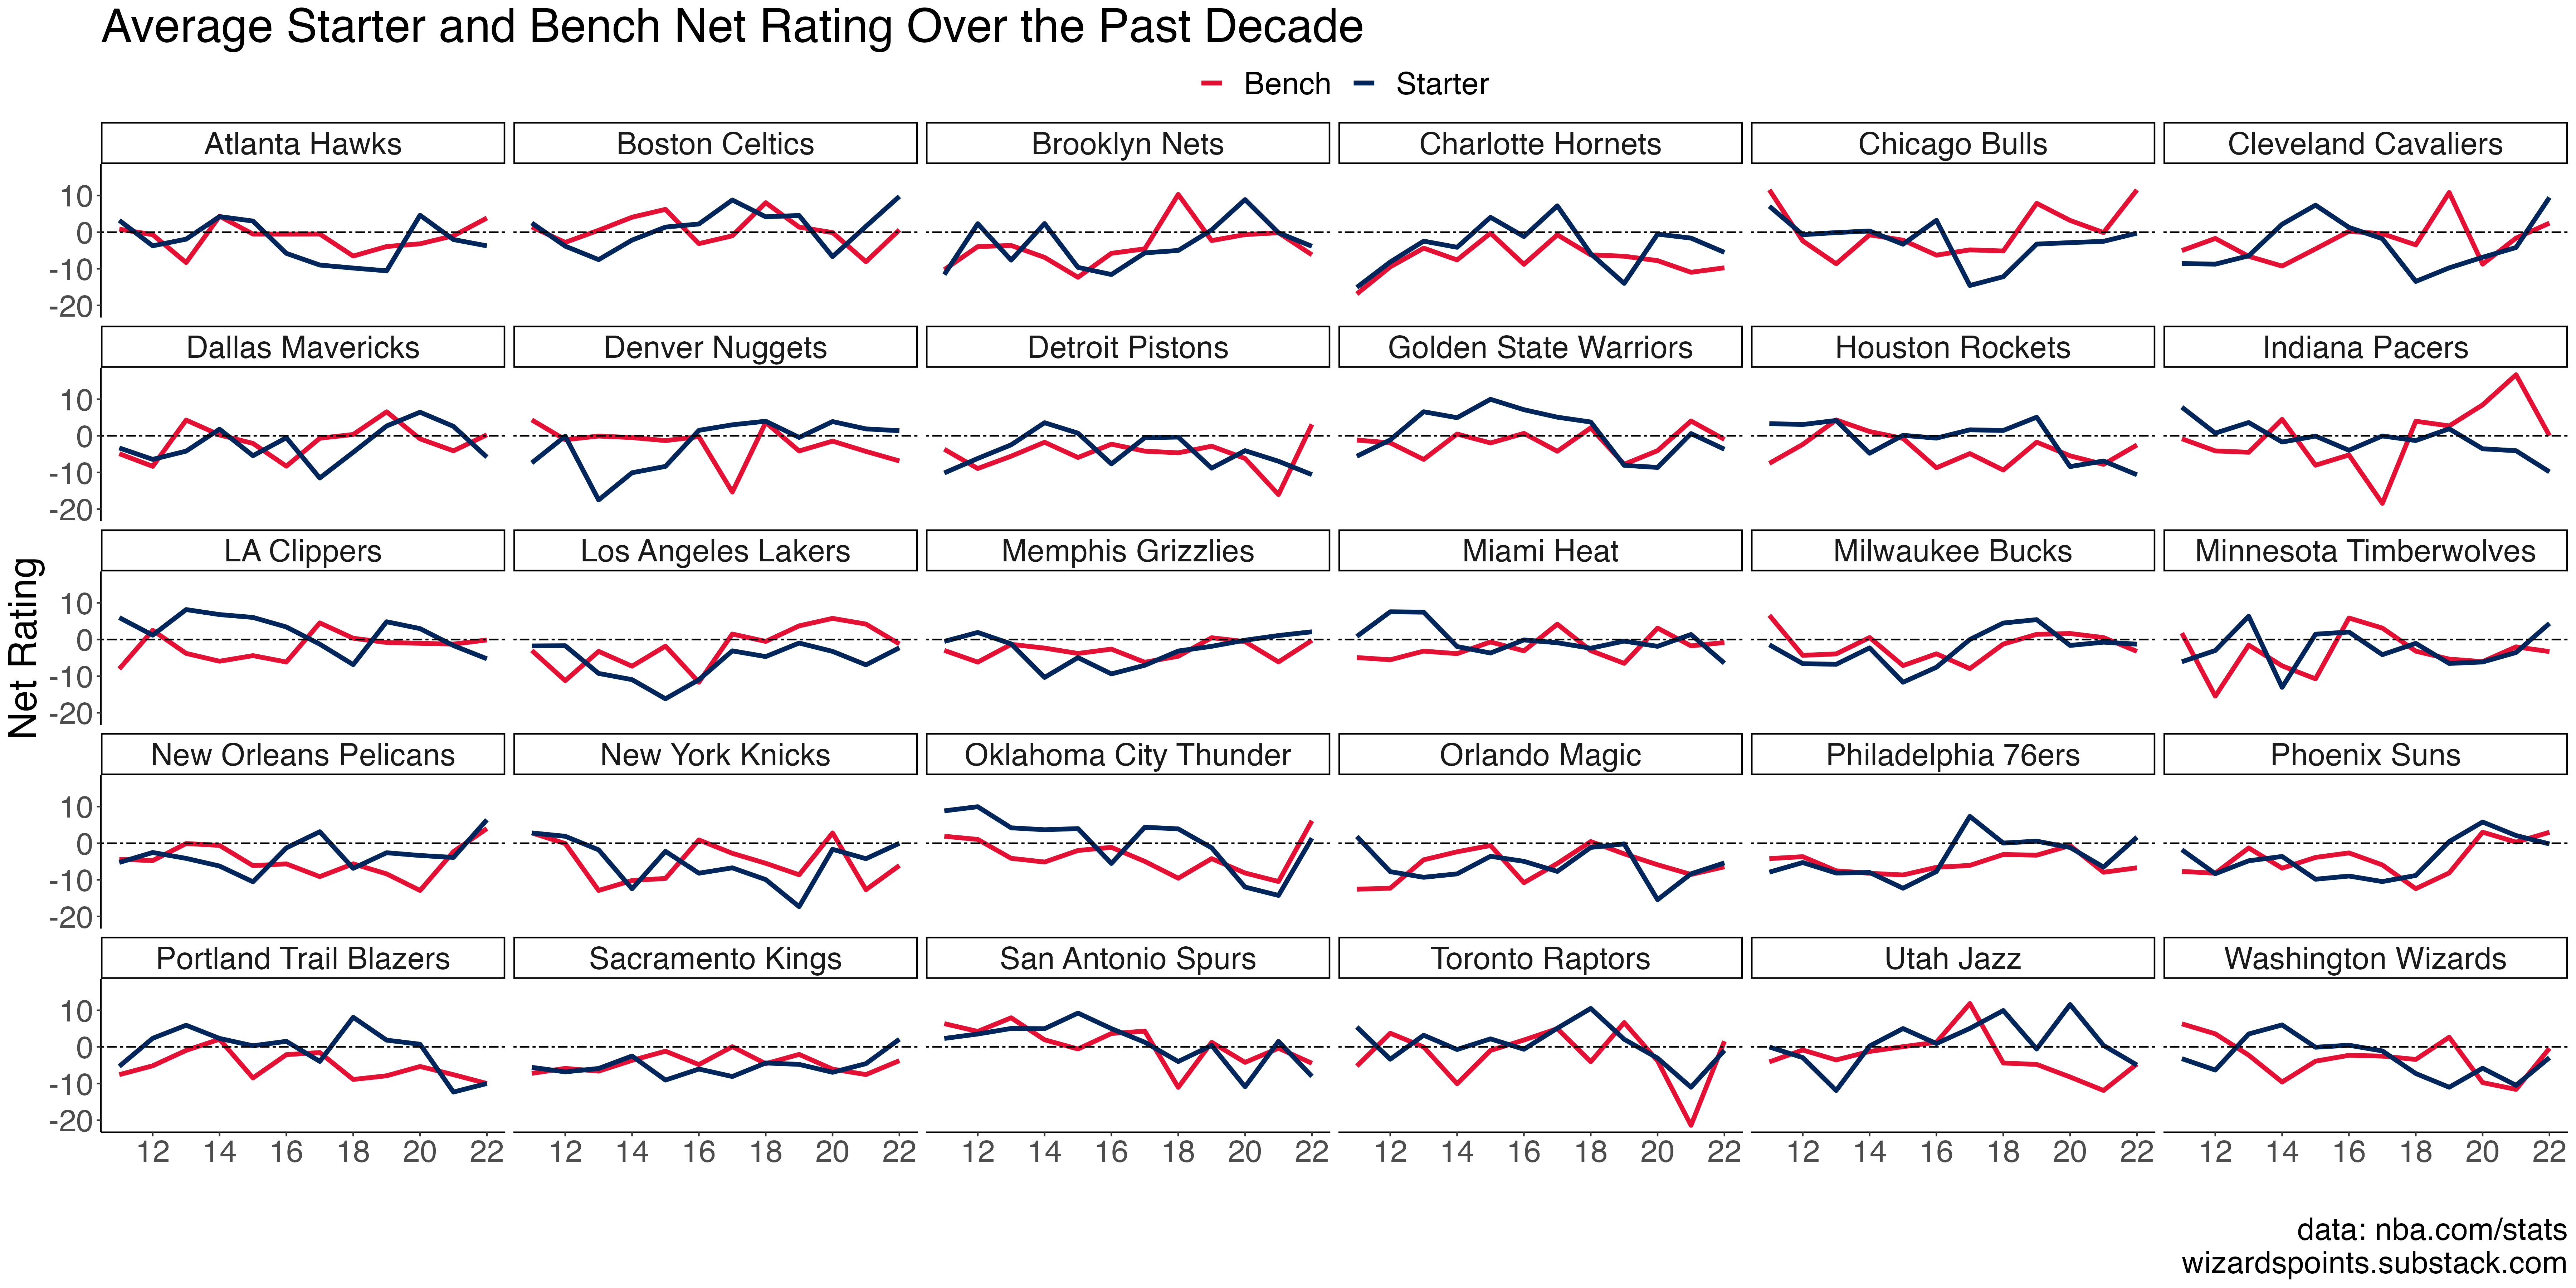
Extending this out over time and across the league, there is a ton of variation. The Heat, Bucks, Suns, and Lakers, for example, have all had benches that, if not exactly amazing, weren’t net negatives. The current iteration of the Hawks hasn’t been very convincing, despite a surprise Eastern Conference Finals appearance a few years ago, and the figure below captures some of what I think I was seeing: a blip in starting performance, but otherwise sub-par play.
Taking a closer look at the Wizards over the past decade or so, you can see it has been the best of times, the worst of times, and the meh-st of times, too. While I look back fondly on the 2014-15 season with Professor Andre Miller’s old man game and the Paul Pierce Wizards experience, I have largely repressed memories of Martell Webster bricks and Kevin Séraphin turnovers.3 The Beal leadership years, circa 2020 through last season, also show a narrowing of performance between the bench and starters, but not really in the direction you’d hope.
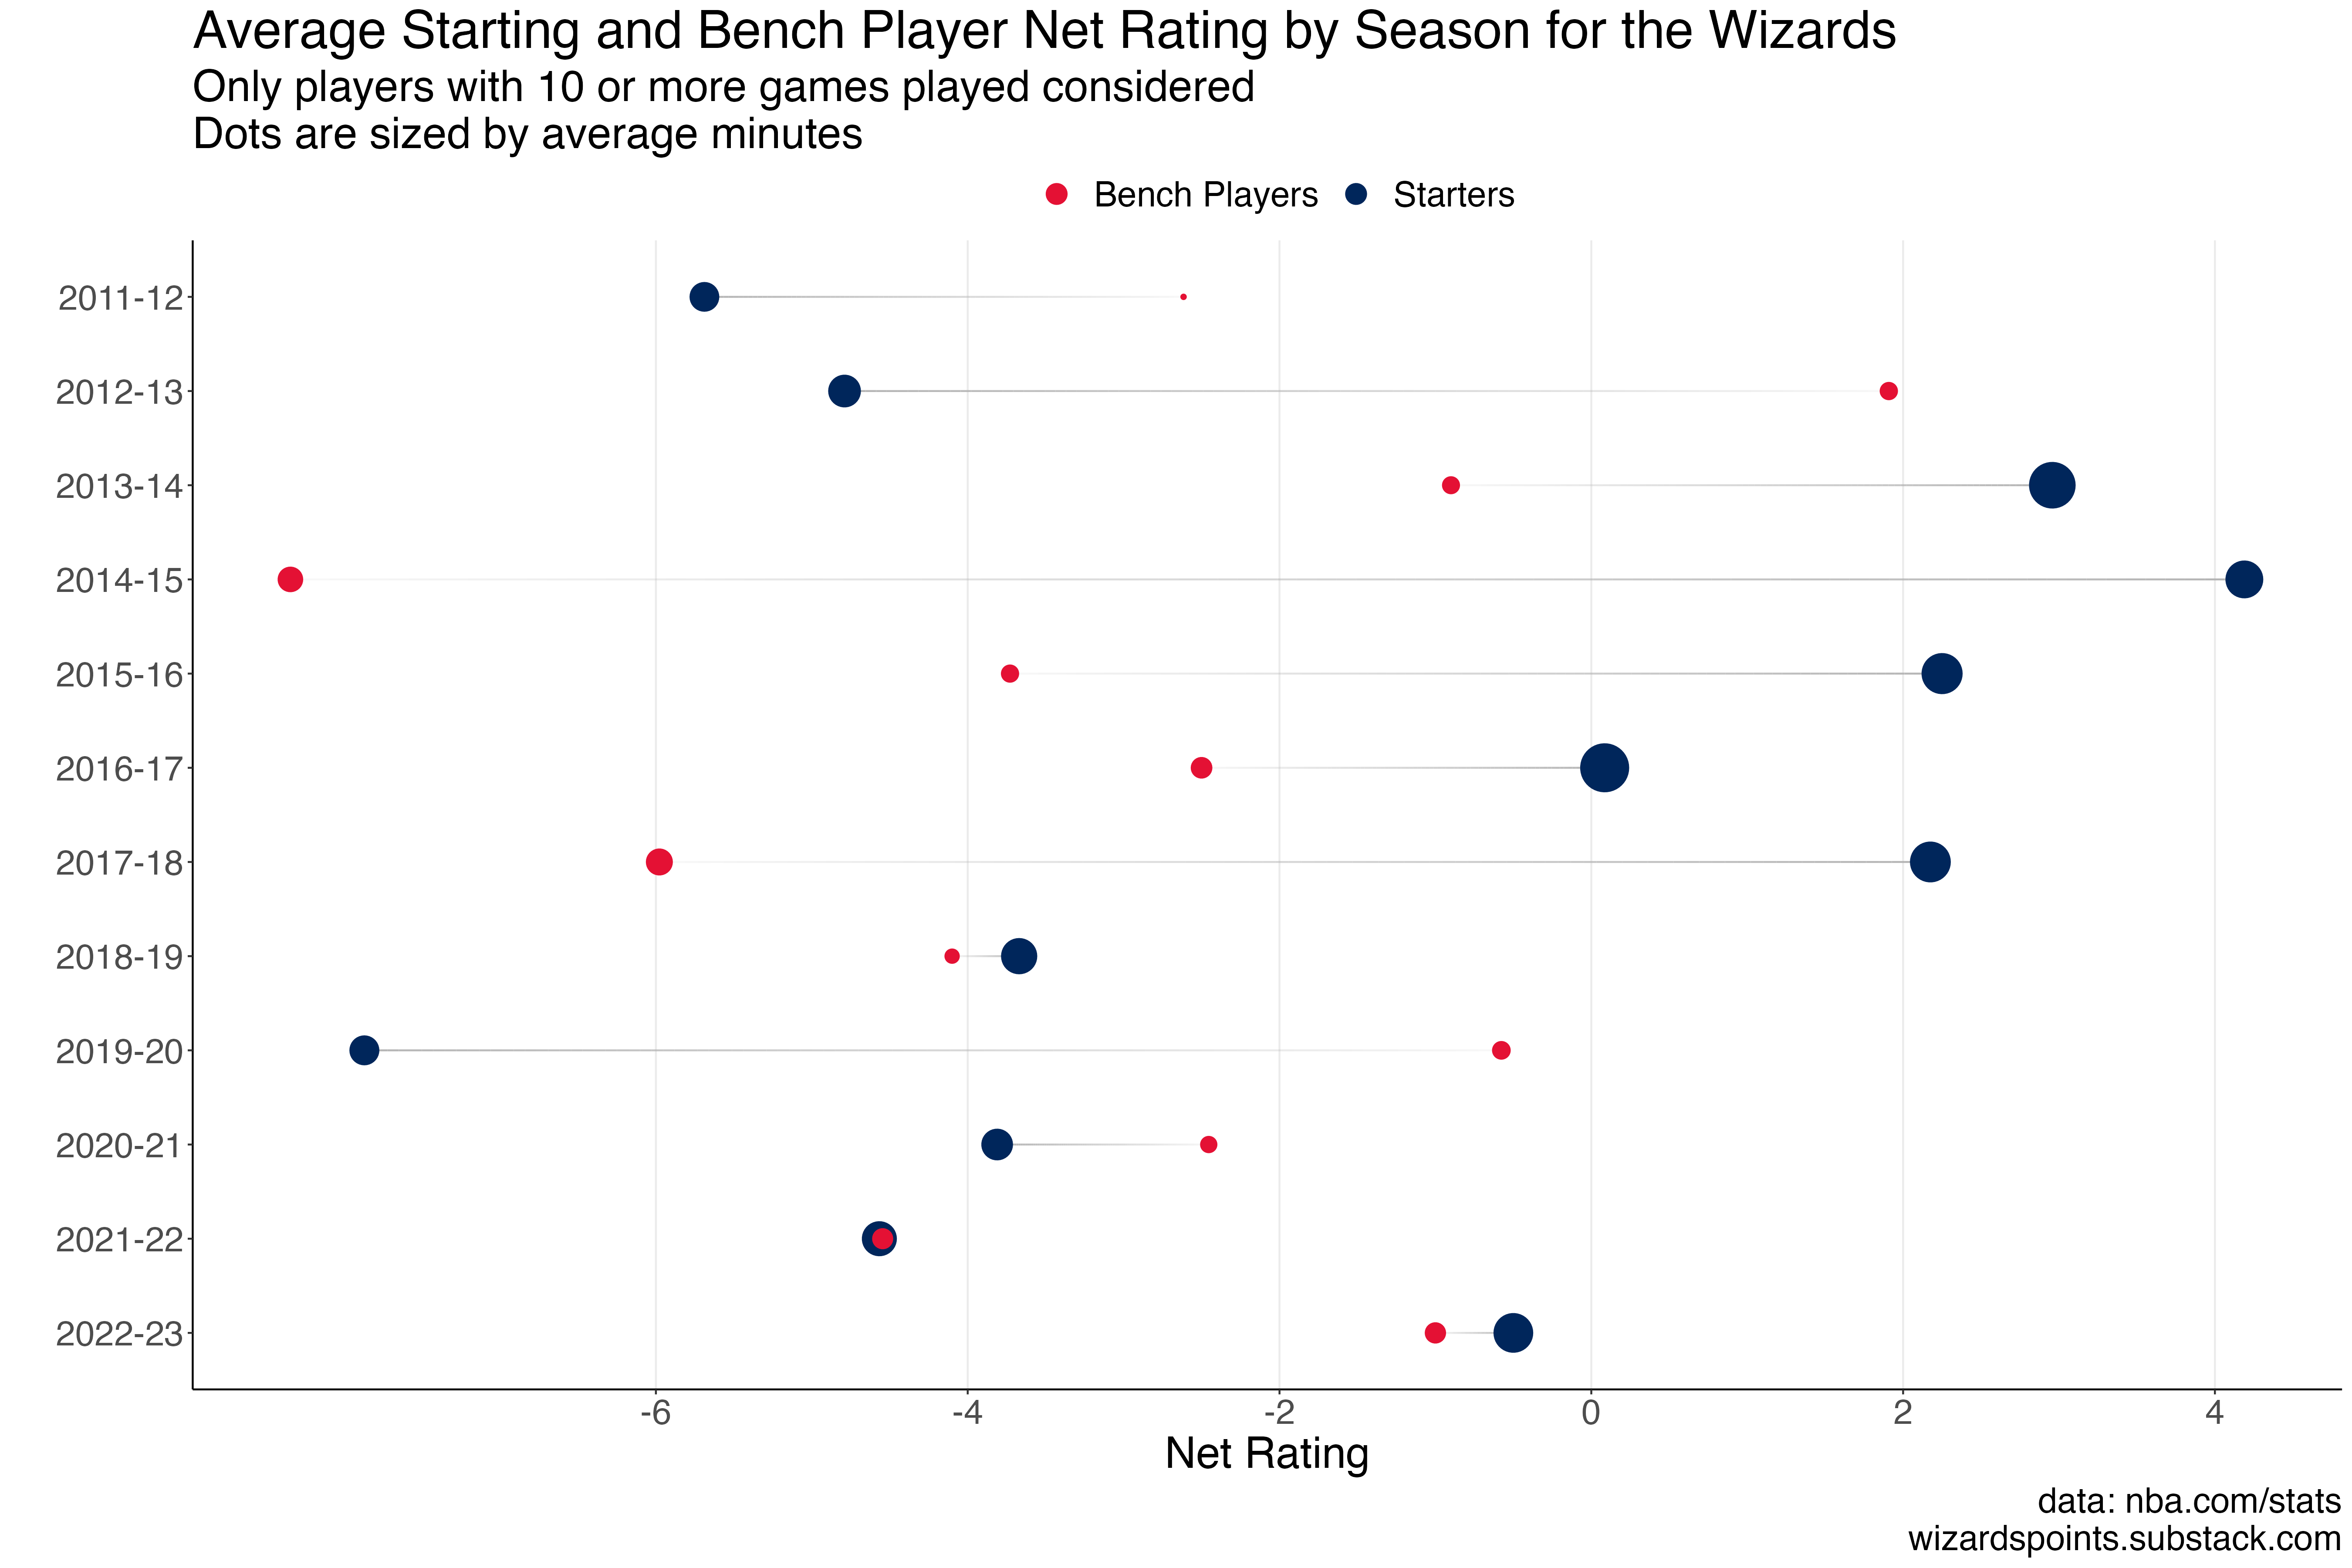
Of course, it’s not surprising that, in general, starters have a higher average net rating than bench players. That’s why they are starters. From the figures above, it seems like really good starting minutes can more than make up for a bad bench. But if we look at the other memorable squad—the John Wall prime season of 16-17—the gap between starting performance and bench performance was relatively narrow, which might suggest that if the bench is decent, their minutes can make up for a less than elite starting group.
The effect of bench minutes
We’re about to dive into a bit complex work, so I’ll just tell you some key findings here:
If we just look at overall numbers, the probability of having a 50+ win season given your bench has a positive net rating is around 49%.4 We find that each one unit increase in bench net rating is associated with a 24% (16-35%) increase in the odds of having a 50+ win season. For the Washington Wizards, bench minutes are associated with a roughly 0.7 percent increase in win percentage after accounting for average bench and starter performance BUT this is not statistically significant, meaning the estimate is just a little too noisy (sometimes it’s positive, but mostly it’s negative).
This is honestly not super surprising given what is shown above, which is that the Wizards starters and Wizards bench just haven’t been that great, on average, so the potential benefit or drawback of the bench isn’t going to have much effect. In contrast, a team like the Warriors has had, on average, bench minutes that are positively correlated with win percentage. You can see what this looks like compared to other teams below.
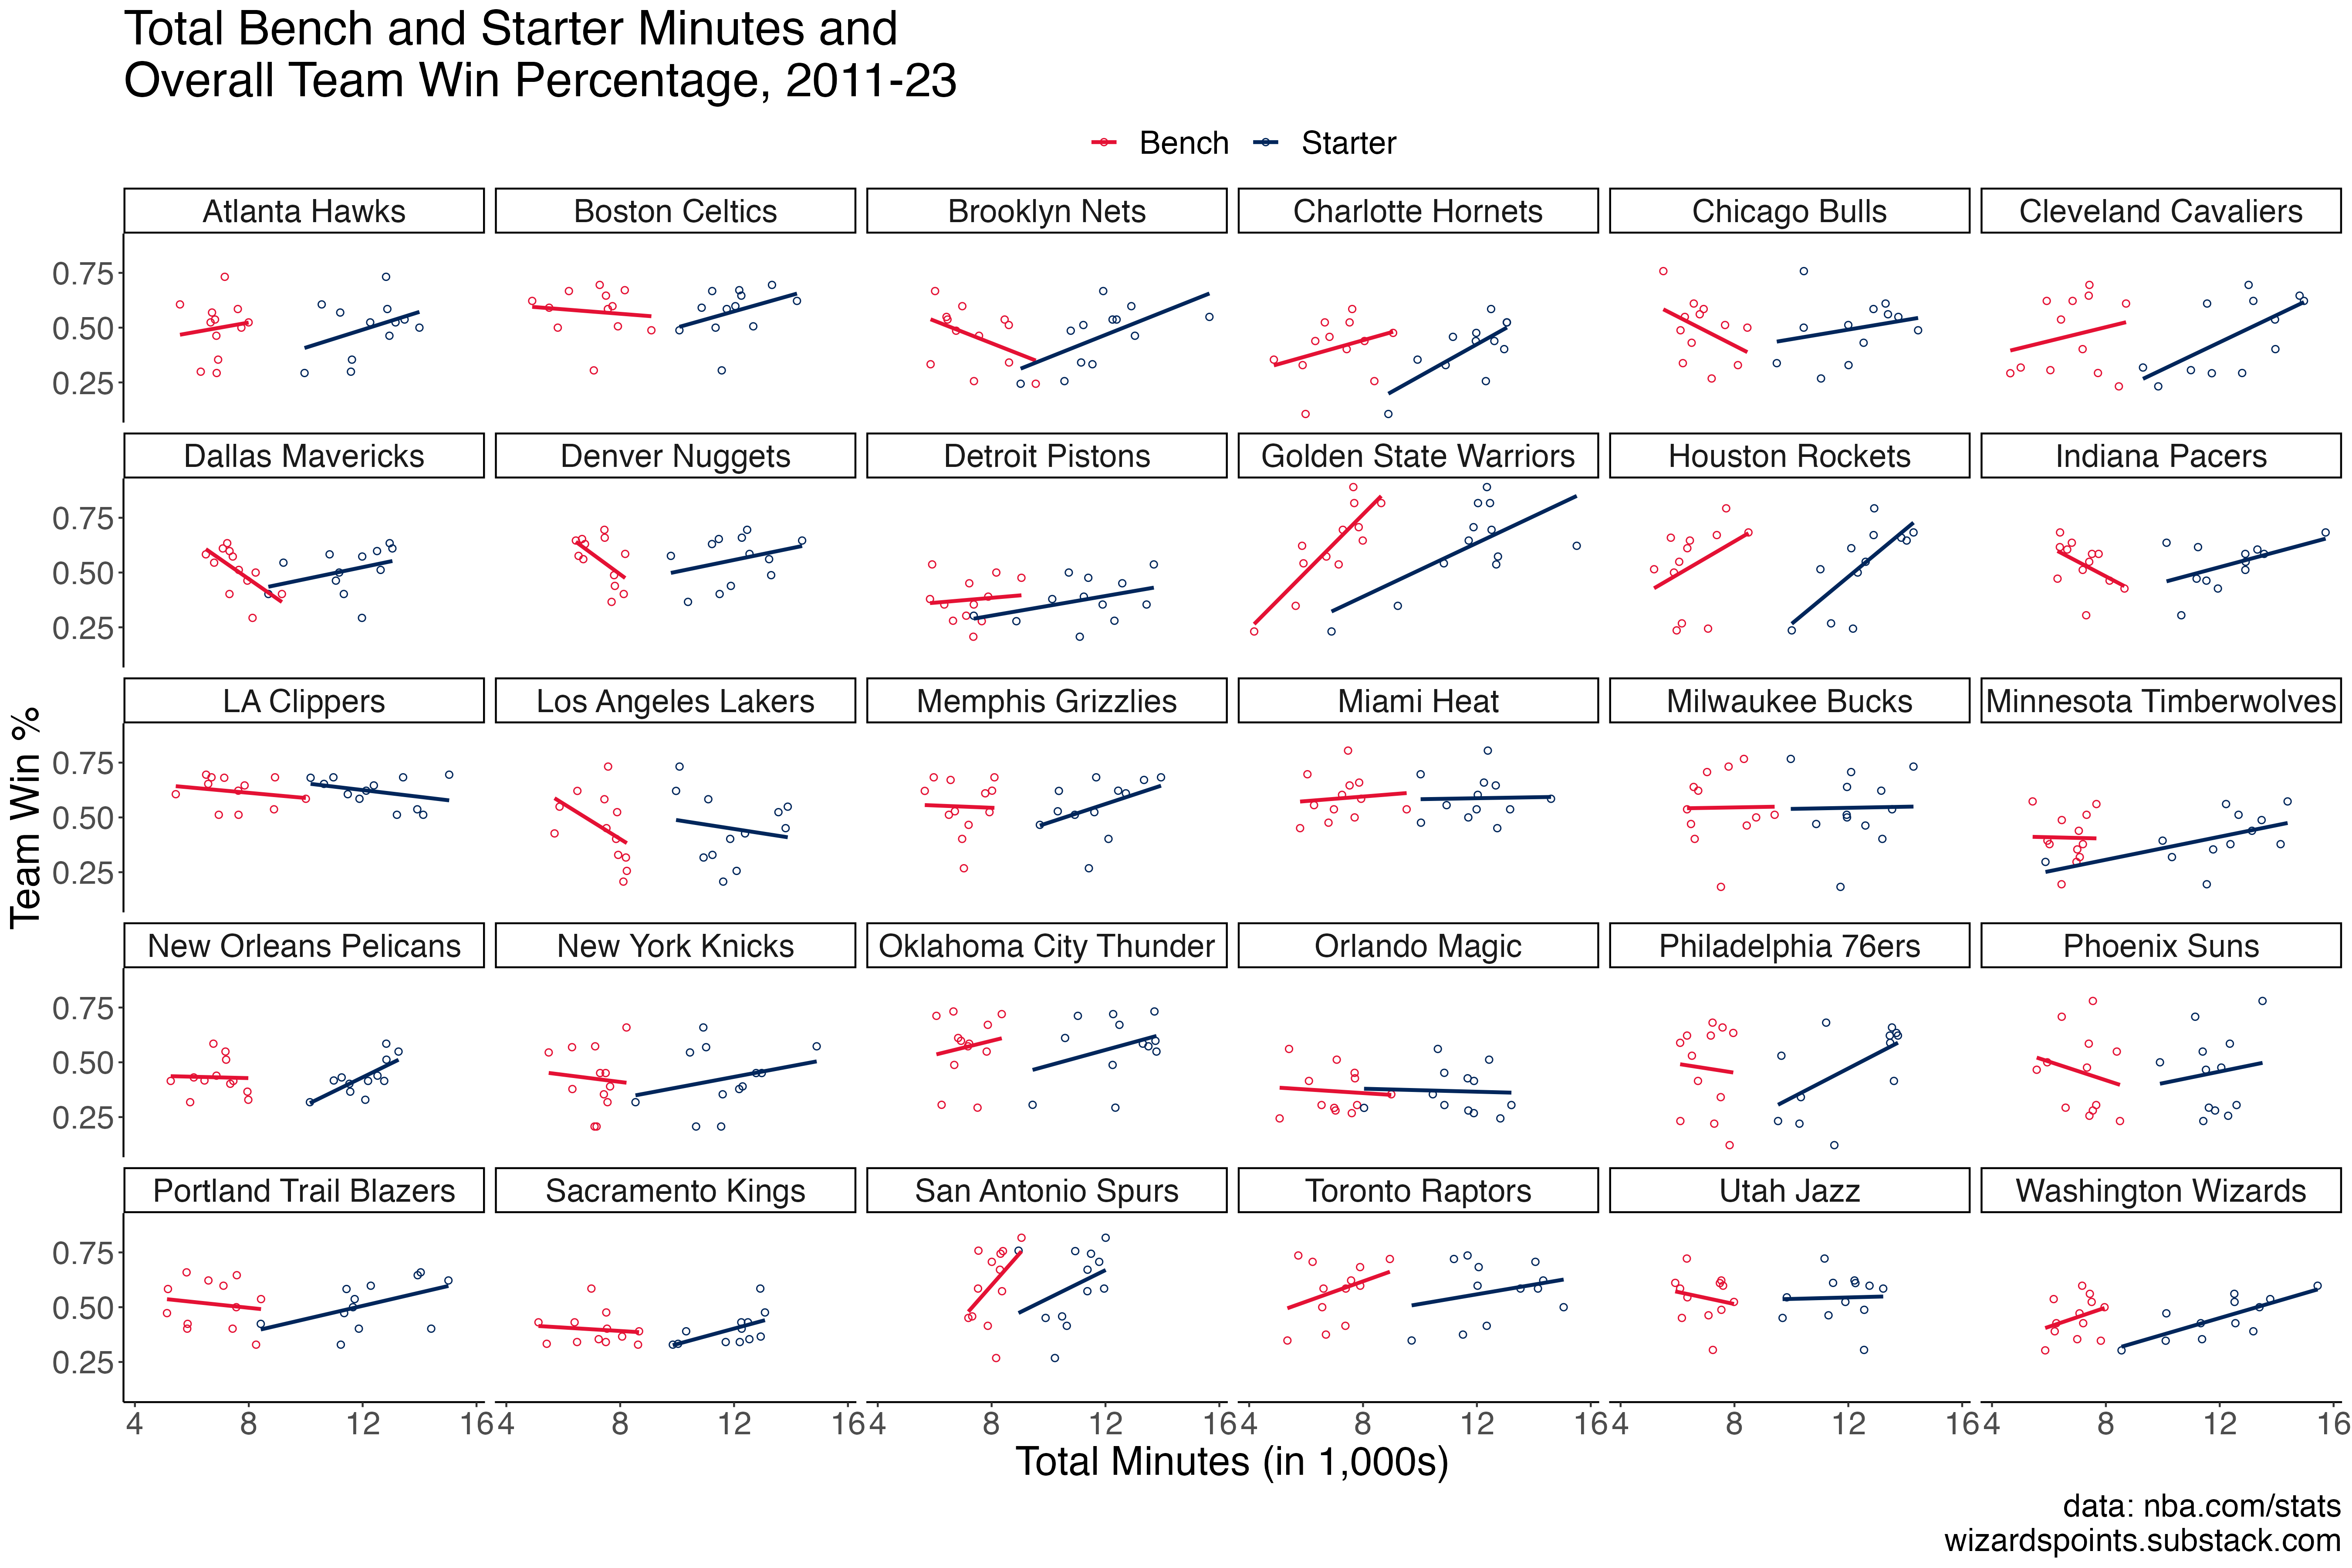
For the Wizards, the difference in total minutes played off the bench and for starters was most narrow for the 19-20, 11-12, 20-21, and 21-22 seasons (in that order). The key thing to look at in this figure is how steep the lines are. A steeper line (one with a higher slope) suggests a stronger relationship. We can see that for some teams, like the Magic, there is basically no difference in the lines (they practically connect), while for the Warriors, the red line for the bench is actually steeper than the blue line, suggesting a stronger relationship between total minutes and win percentage. Then you have cases like the Nets, where the more their bench plays, the less they win, on average. One other thing that I didn’t expect, but should have seen coming, is that there is clear separation in minutes. Of course there is: teams play their starters way more, almost by definition, but there are cases where the gap is larger than I would have expected, like the Pacers and Hawks.
How to isolate bench performance?
There are any number of overlapping and contrasting on- and off-court elements that affect overall wins. Are the players healthy? Did they just get into town at 3AM? Are they just kind of done with the season? How hard has the schedule been?
For this analysis, we tried to simplify things as much as possible. To do this, I somehow convinced my good pal, Simon, to work with me on coming up with an approach for understanding bench performance. Simon5 developed the figure below showing a general model of how we try to understand the relationship between starter and bench performance and overall season win percentage. Basically, performance, as measured by net rating, affects winning. Yes, there are other ways to capture performance, but net rating normalizes things per 100 possessions, so we don’t need to worry about usage and pace and games played, and it’s available for nearly every player (other metrics that attempt to be all encompassing tend to require players to have 1,000 possessions or whatever). But what affects performance? If we don’t account for that in our model, we’ll potentially bias our results. After a lot of discussion at the Silver Spring library/Wizards Points HQ Annex—and, admittedly, a few drinks—we decided that availability also affects winning. If guys are getting minutes, if they’re healthy and suited up, that should have some influence on winning, too. Also, because most performance metrics, including net rating, are normalized across players, the model needs to have some way to differentiate between a bench like the Pelicans, which has not seen much court time, and one like the Warriors, which is key to their success.
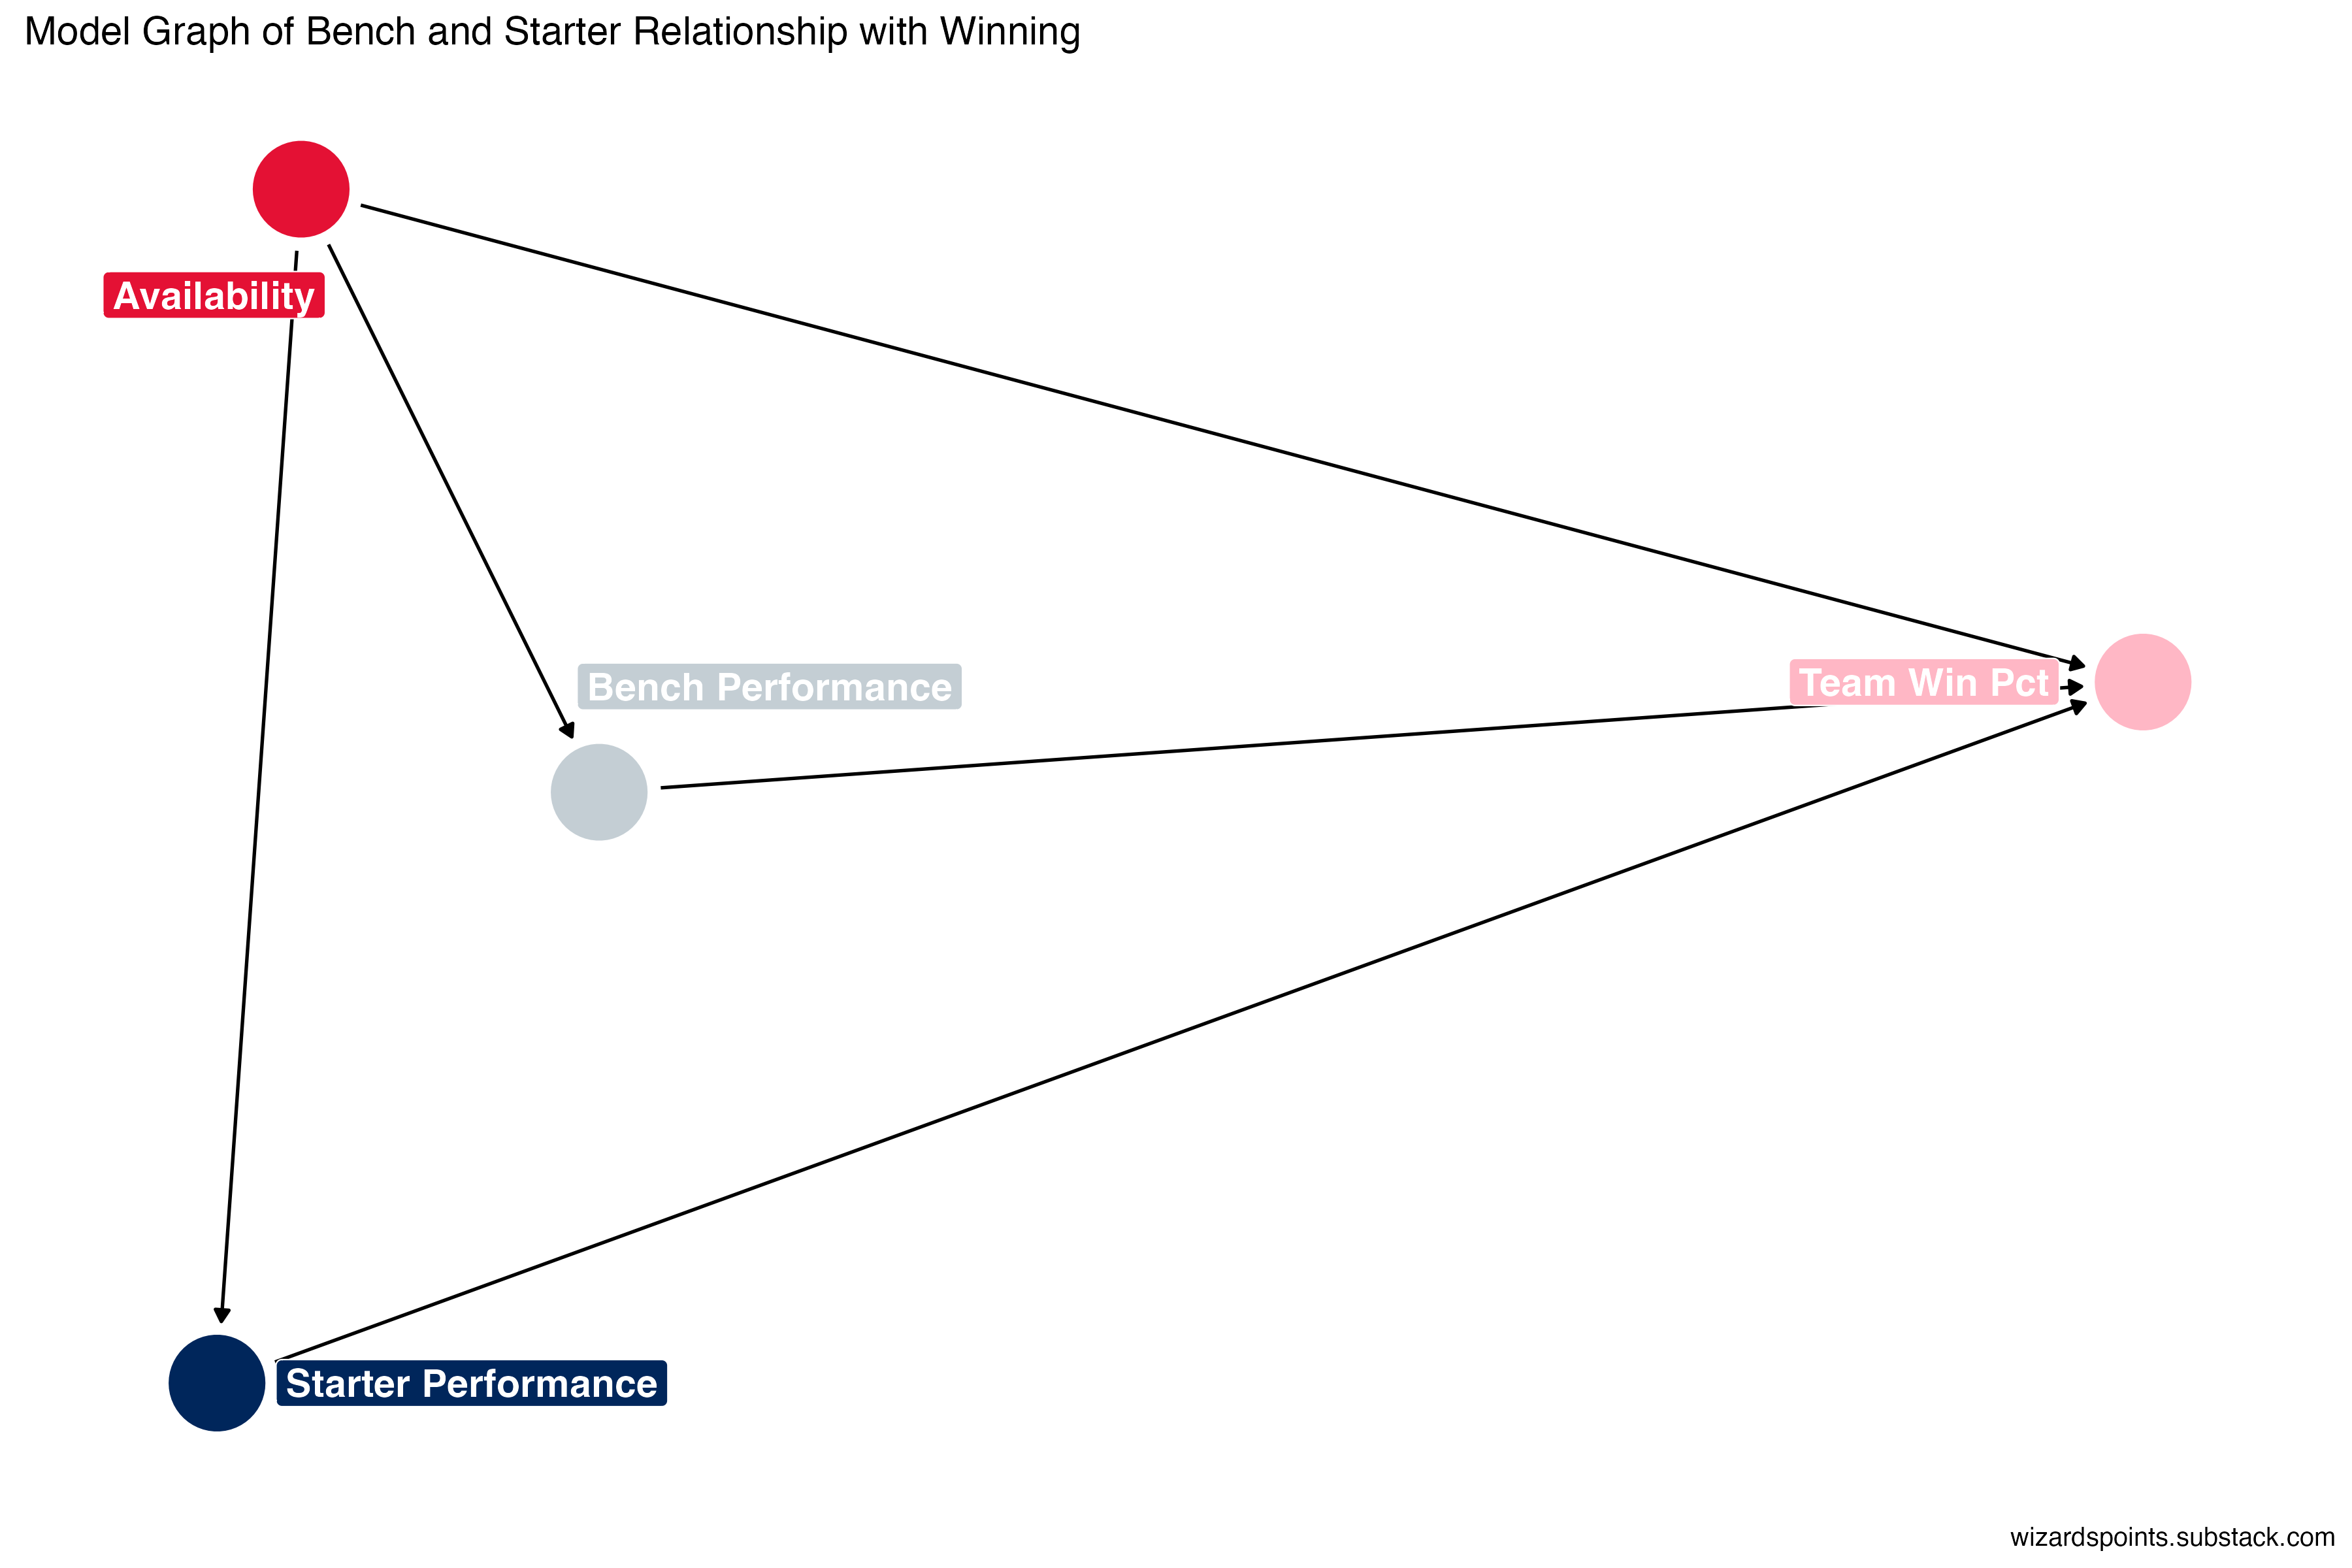
We are basically treating this as an experiment, where the “treatment” is being on the bench and we are asking/modeling, what is the relationship of the bench relative to starters when it comes to win percentage and after accounting for the fact that starters tend to be better at basketball than the bench.
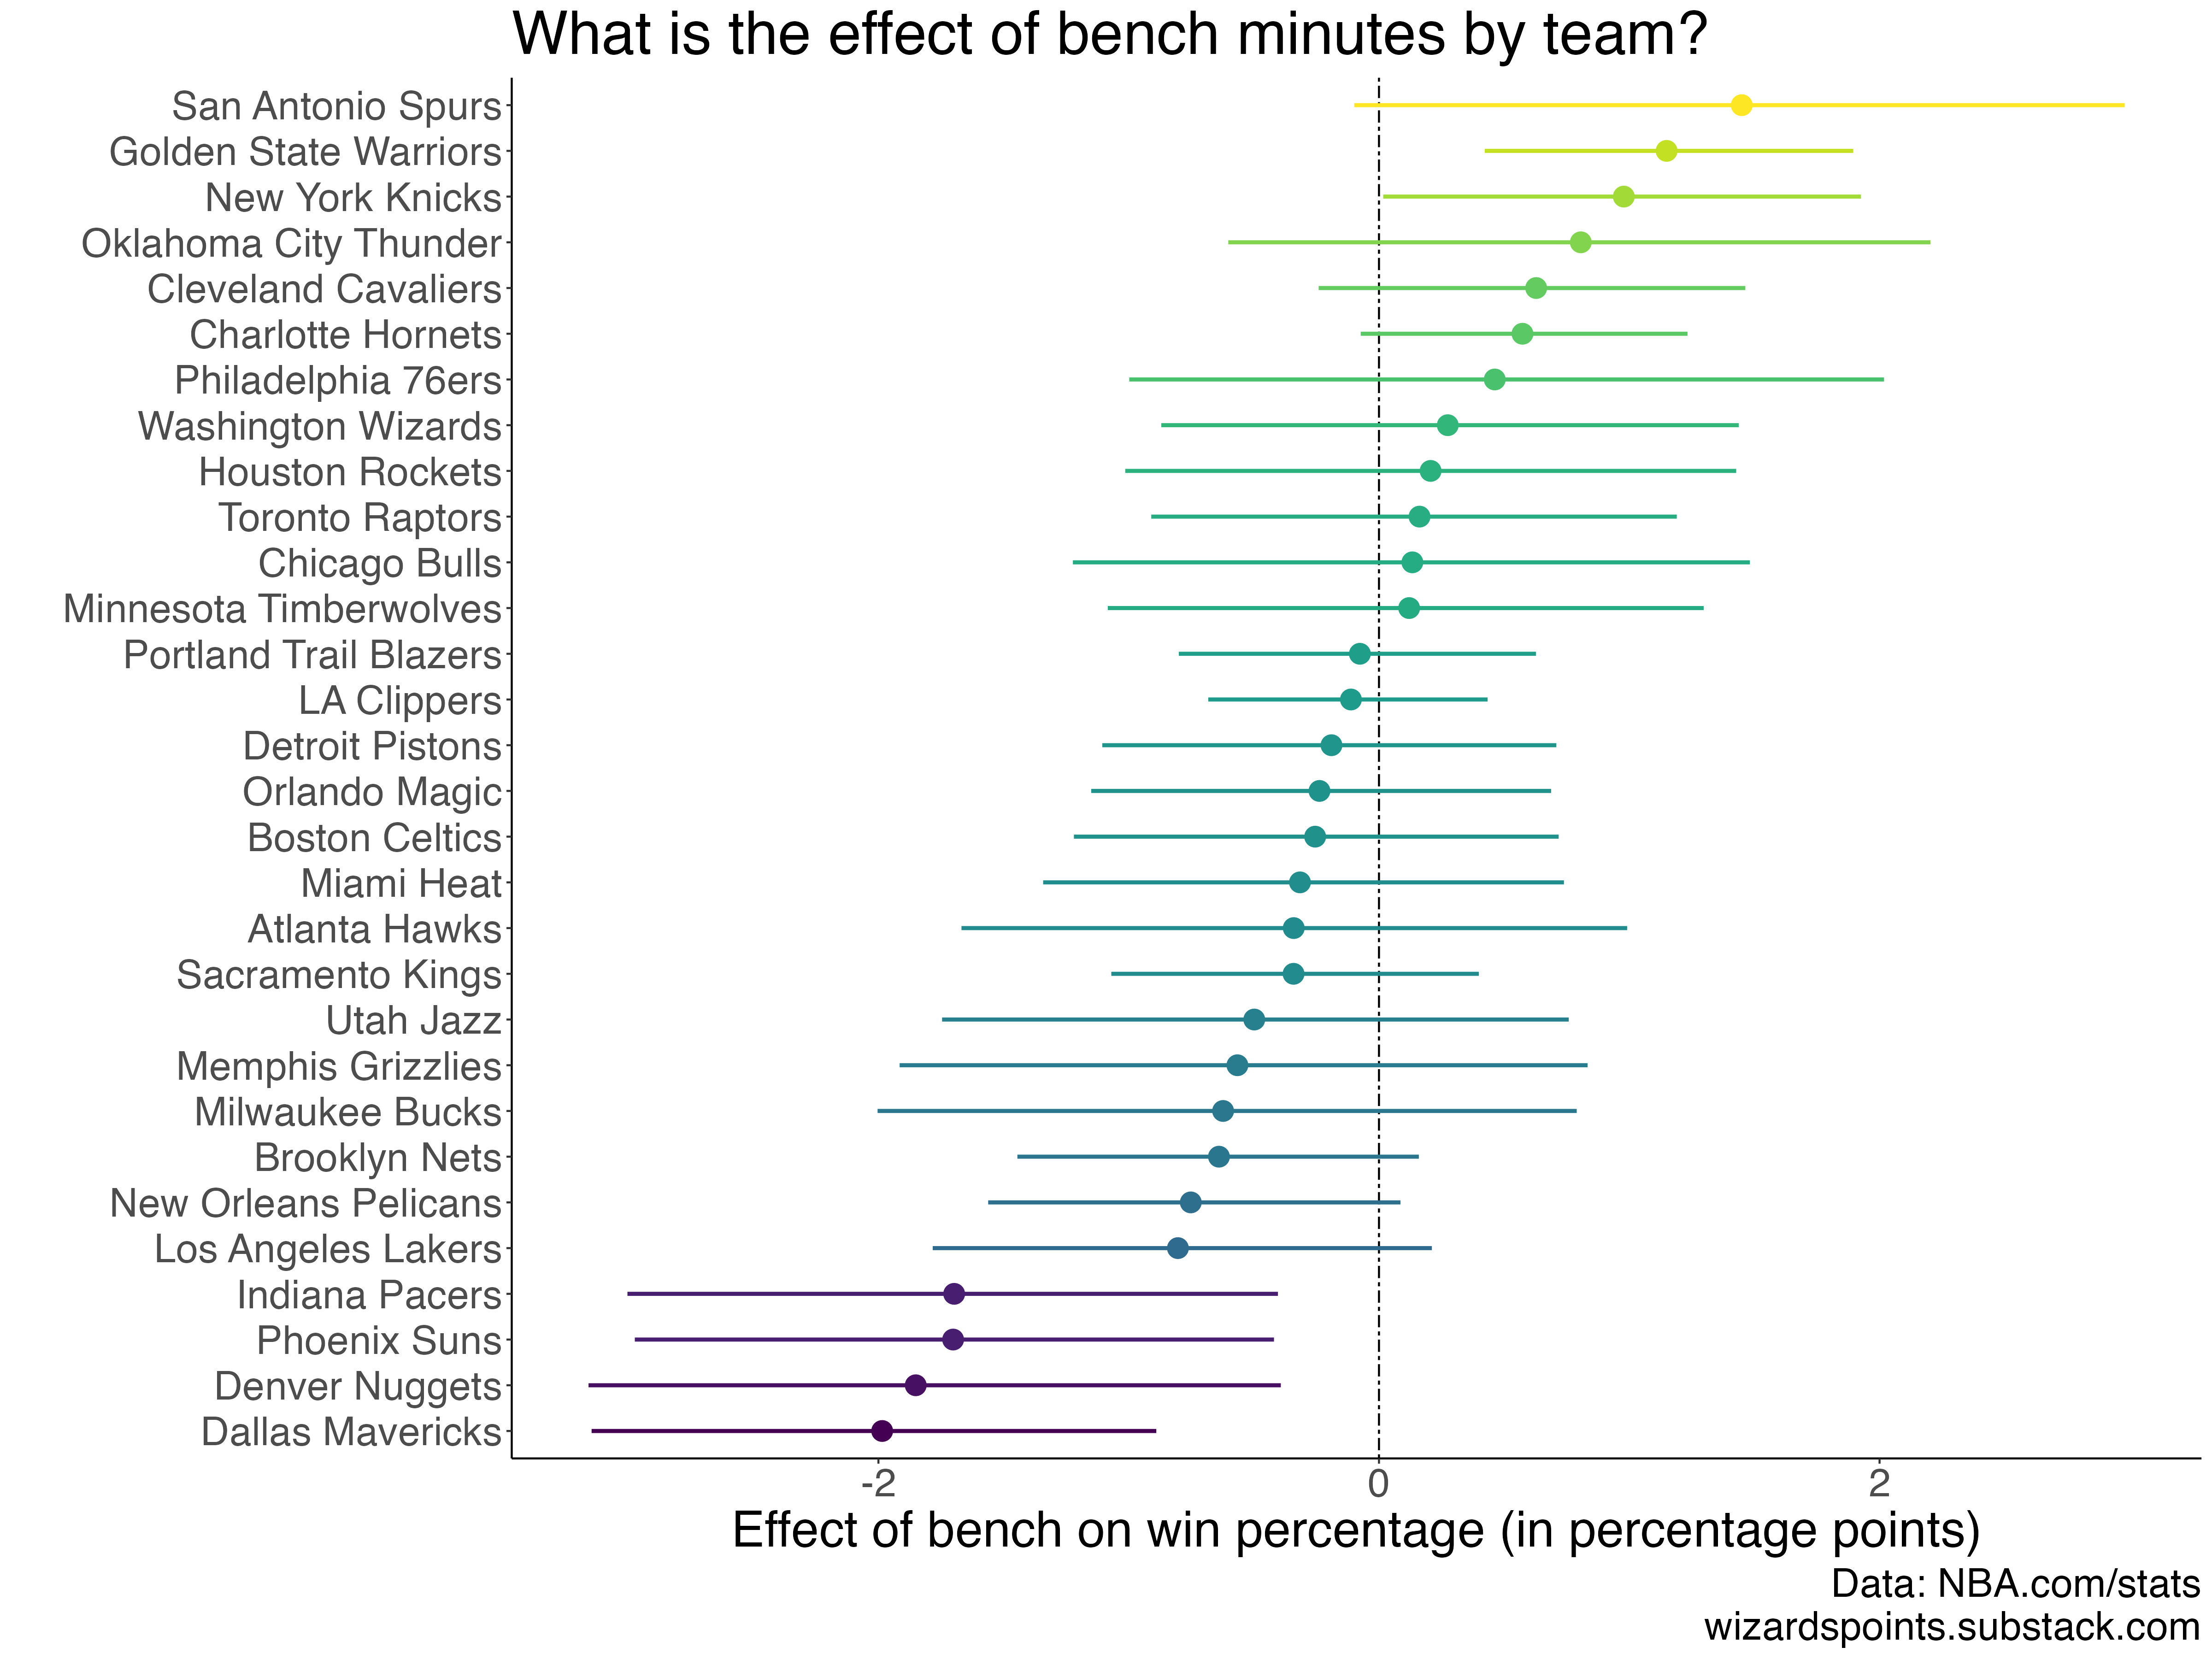
One way to look at the figure above is that for the dots on the left side of the line (denoting zero), their benches are hurting more than they’re helping. For the teams with dots on the right size of the line, their benches generally are helping their overall season win percentage. These are all averages, so it’s certainly true that a team like the Lakers can have a player save a game here or there (look up “Walker, Lonnie”), but if we look over the past decade, there haven’t been many of those games.
If we dive into what this looks like for the Wizards, each additional minute off the bench is associated with between -0.8% and 2% change in overall win percentage. But what about teams that, uh, win more?
In our analysis, the Warriors bench is clearly the strongest over the past 10 years. We find that each additional minute of bench time on the season is correlated with a 0.97 to 3.35% increase in win percentage. That’s huge. Surprisingly, some very good teams tend to have less than stellar benches. The Nuggets stand out here, with each additional total bench minute on the season associated with a roughly -3% to -0.12% change in win percentage. On some level, this makes sense if you have one of the greatest current players on your team. It also aligns with the on-off career numbers for Jokic (average +13.49 points when he’s on vs. off over the past eight seasons) and Murray (+6 average over the past six seasons). Boston’s lack of depth comes through, too, with each additional total bench minute on the season associated with an average -0.08% (95% CI of -1 to 0.85%) change in win percentage. These results make sense when you look at their bench player on/off numbers: Robert Williams (-1.38), Payton Pritchard (-5), and Grant Williams (-2.95). And yeah, on/off numbers are misleading precisely in the case where you have to be the poor guy giving Jason Tatum a break. Going back to the Lakers example, even if their bench hasn’t been great overall, they had the highest average net rating of the past decade the season they won the championship, with the second and third highest average bench net rating coming the two seasons before that.
What to make of it all
This has been a long post. There is a lot of data and even more analysis that didn’t make it in. Still, there are a few key points that stand out:
A good bench seems to increase the odds of being a good team, a bad bench with good starters increases the odds of being a good team, a bad bench with bad starters increases the odds of being the Wizards. But it doesn’t have to be this way! These are all averages and every team (well, almost every team) has an above average season from time to time.
Having a good bench can help with regular season success even if it doesn’t translate into a ring. No surprises here. While there are some elite teams with an overall average positive “bench effect,” most of them haven’t won championships, but they have had made it to and sometimes had strong playoff runs (e.g., the Knicks, Thunder, Rockets, and Spurs).
The data on the Wizards over the past three years not only tracks with the eye test, it captures my general sense of laugh-to-keep-from-crying that defined the Beal era. If there’s a recommendation here going into a rebuilding season, it’s that the Wizards need to invest in everyone on the roster. Absent getting a generational talent, it will be important to invest in some key starters and the sixth and seventh (and who knows, eighth) guys to gradually get to that 50 game win mark once the team actually starts to build something.
Notably, the Wizards had the highest number of players who started in our data. This says more about their injuries and roster construction than some 3D chess-level coaching.
As always, data and code are on Github here. Unless otherwise noted, all modeling is only for players with at least 10 games in a season.
For the record, I liked Webster. The dude did miss a lot of shots, though.
This is just Bayes theorem, where we have 97 of 360, teams/season with a positive bench net rating on average (P(A)), 92 of 360 teams/seasons with 50+ wins (P(B), and 48 teams/seasons with a positive net rating bench and 50+ wins to 44 with 50+ wins and a negative net rating bench, or 48/92 for (P(B|A). Just plug that in to get the 49%:
Love the Simon cameo! Did not love the Seraphin flashbacks.