
The Pace Race
Taking a look at in-game possessions

Look, I’m full of glitches, defects, hazards that might at any moment plunge me into a state of dramatic decline…
Jhumpa Lahiri, Whereabouts
Every possession counts. Anyone who has watched the Wizards get a five second violation on an inbound pass is painfully aware of this fact. But more possessions do not always mean better play or more points. In fact, people have pointed out that teams that play a slower game, with fewer possessions per game, tend to do better in the post-season (with some notable exceptions).
The issues with the Wizards are well-known. They’re ranked 8th in turnovers (that’s not so good), 22nd in defensive rating (that’s bad), and 28th in three-point percentage (yikes). When it comes to how they use possessions, how they stack up in the league overall doesn’t quite tell the full story.
The tortoise and the Harrell
The Wizards are ranked 22nd in pace factor, which is a formal measure of how many possessions a team uses in 48 minutes, at 99.3. This puts DC just behind Indiana and Atlanta and ahead of New Orleans. The Wizards pace stat seems to align with how I think about their style of play. The team just doesn’t move that quickly. Aside from Kyle Kuzma, Montrezl Harrell,1 and some of the young guys, the team sometimes moves like they have been relaxing and suddenly someone asked if they can get up to take the trash out. “Sure,” they answer as they slowly stand up from the couch, “I can do that…just need to walk over to the ol’ tennis shoes.”
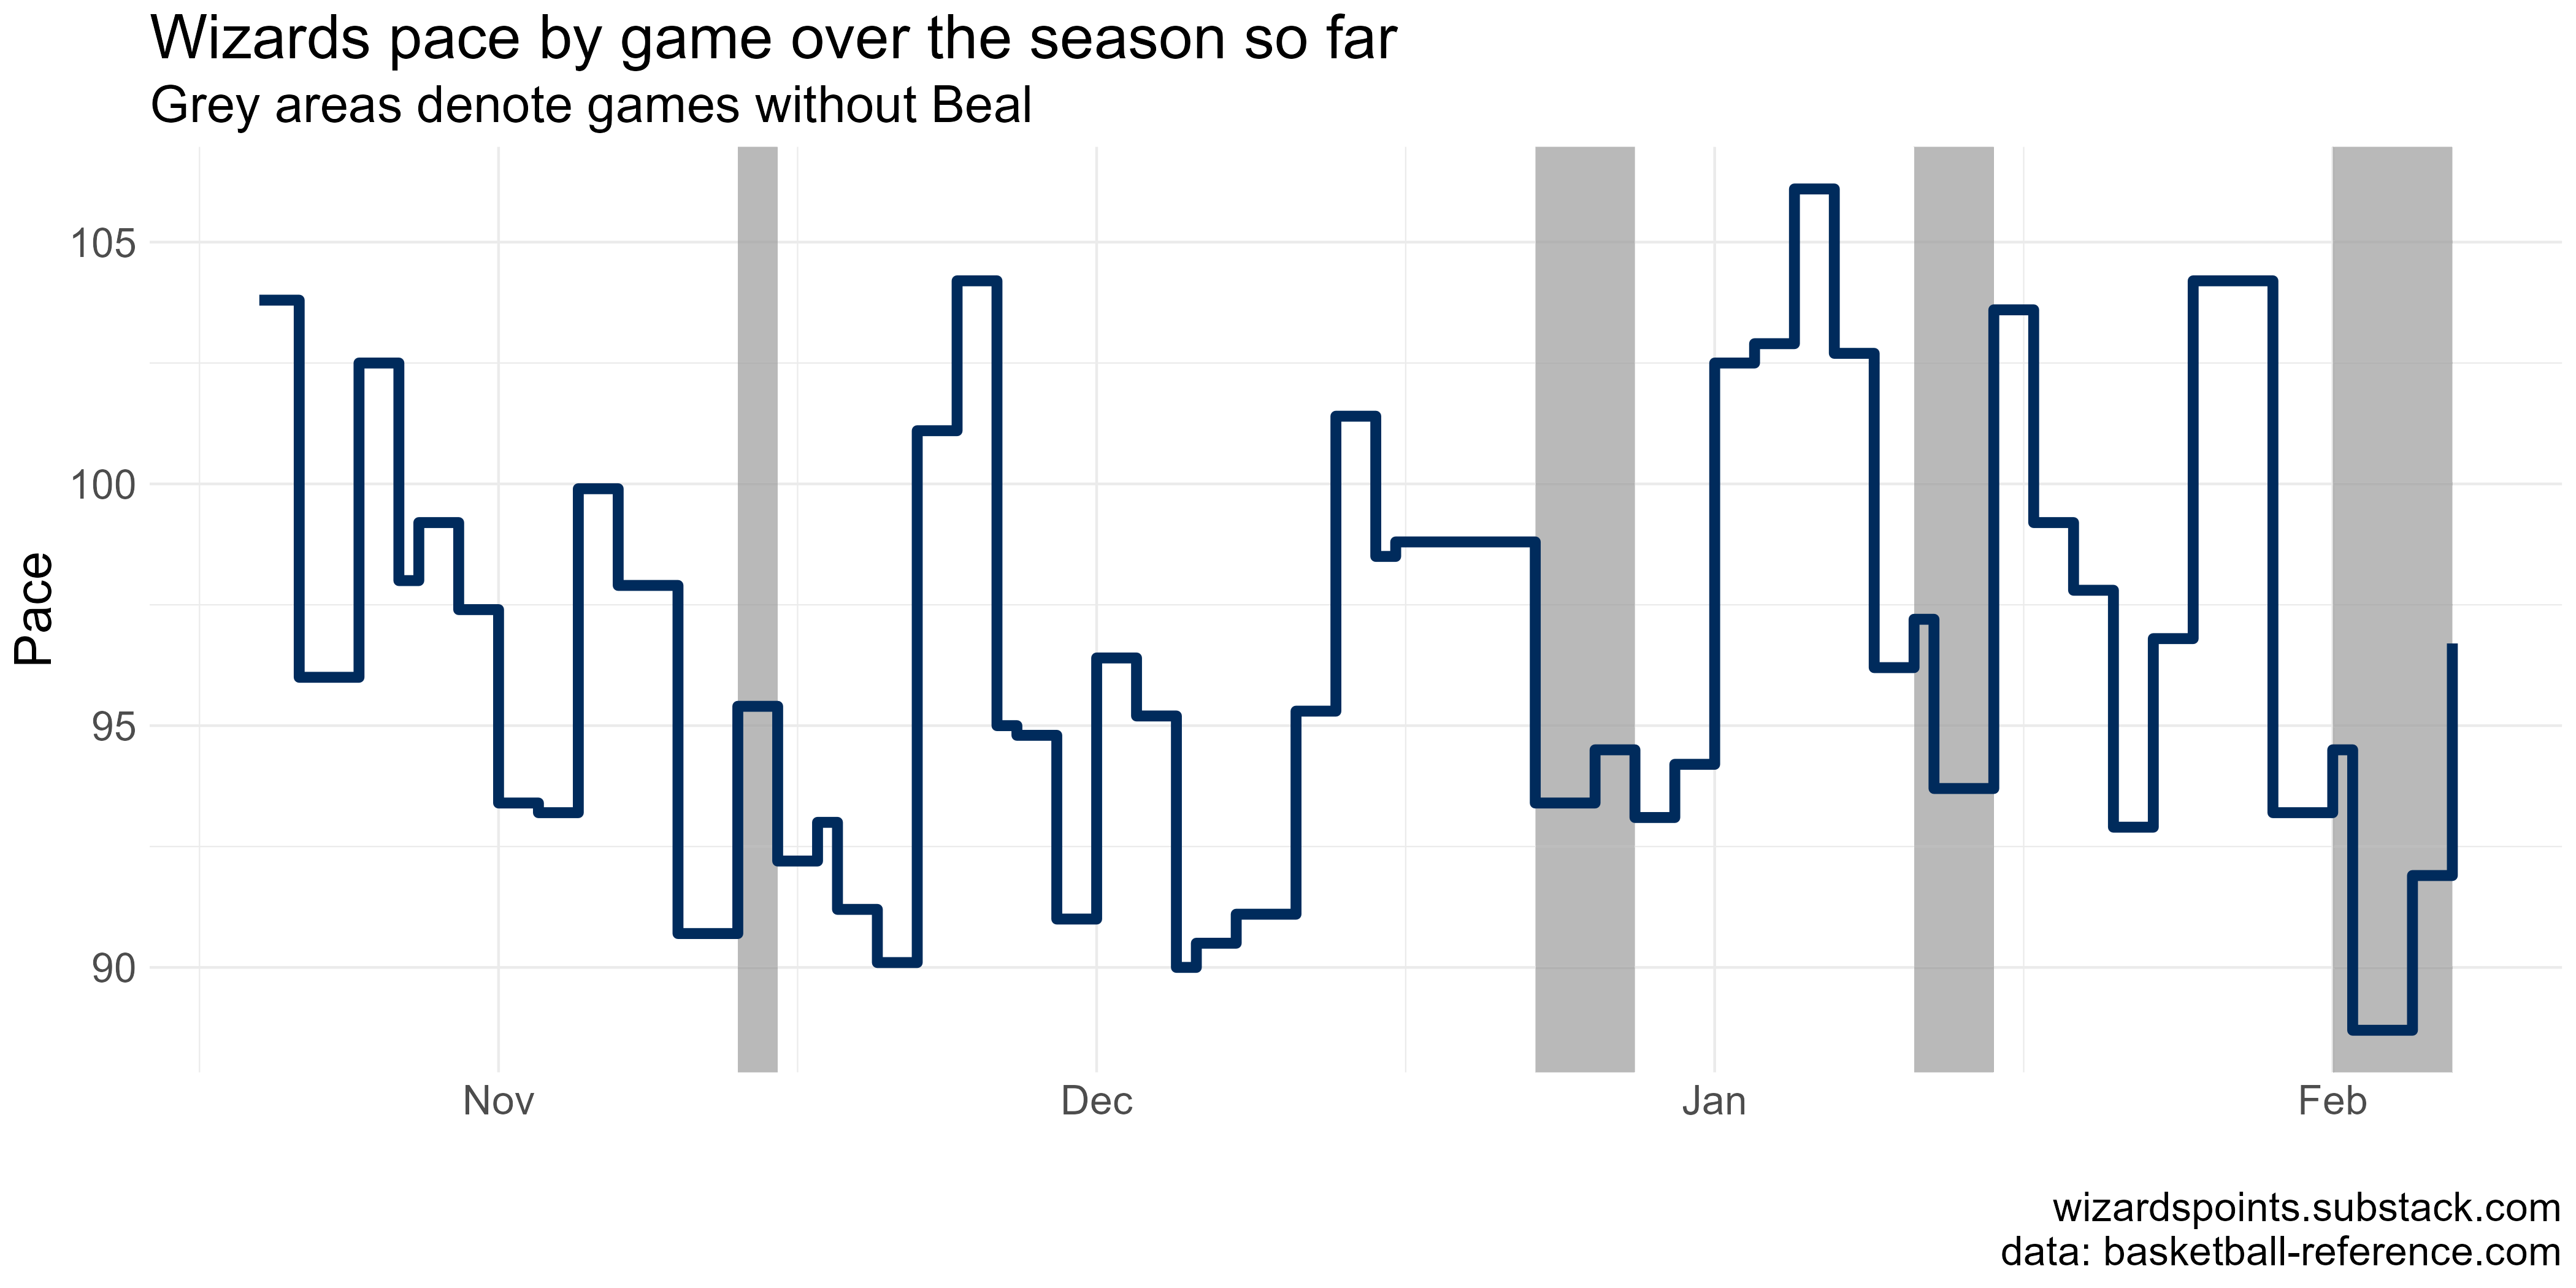
The Wizards played 1,451 of their 5,106 possessions (28.4%) with Spencer Dinwiddie in the game and Bradley Beal sitting. February has been rough for a lot of reasons, but in particular, the Wizards have played a lot of lower pace, high efficiency teams like Miami and Philadelphia. With Dinwiddie as the main point guard, he sets the tone and speed of possessions, which brings down the overall pace. This is fine is you are setting plays up in the way that the Heat do. For the Wizards, though, this often results in wasted possessions where someone like Kuzma is given the ball right before the shot clock runs out.
In game pace
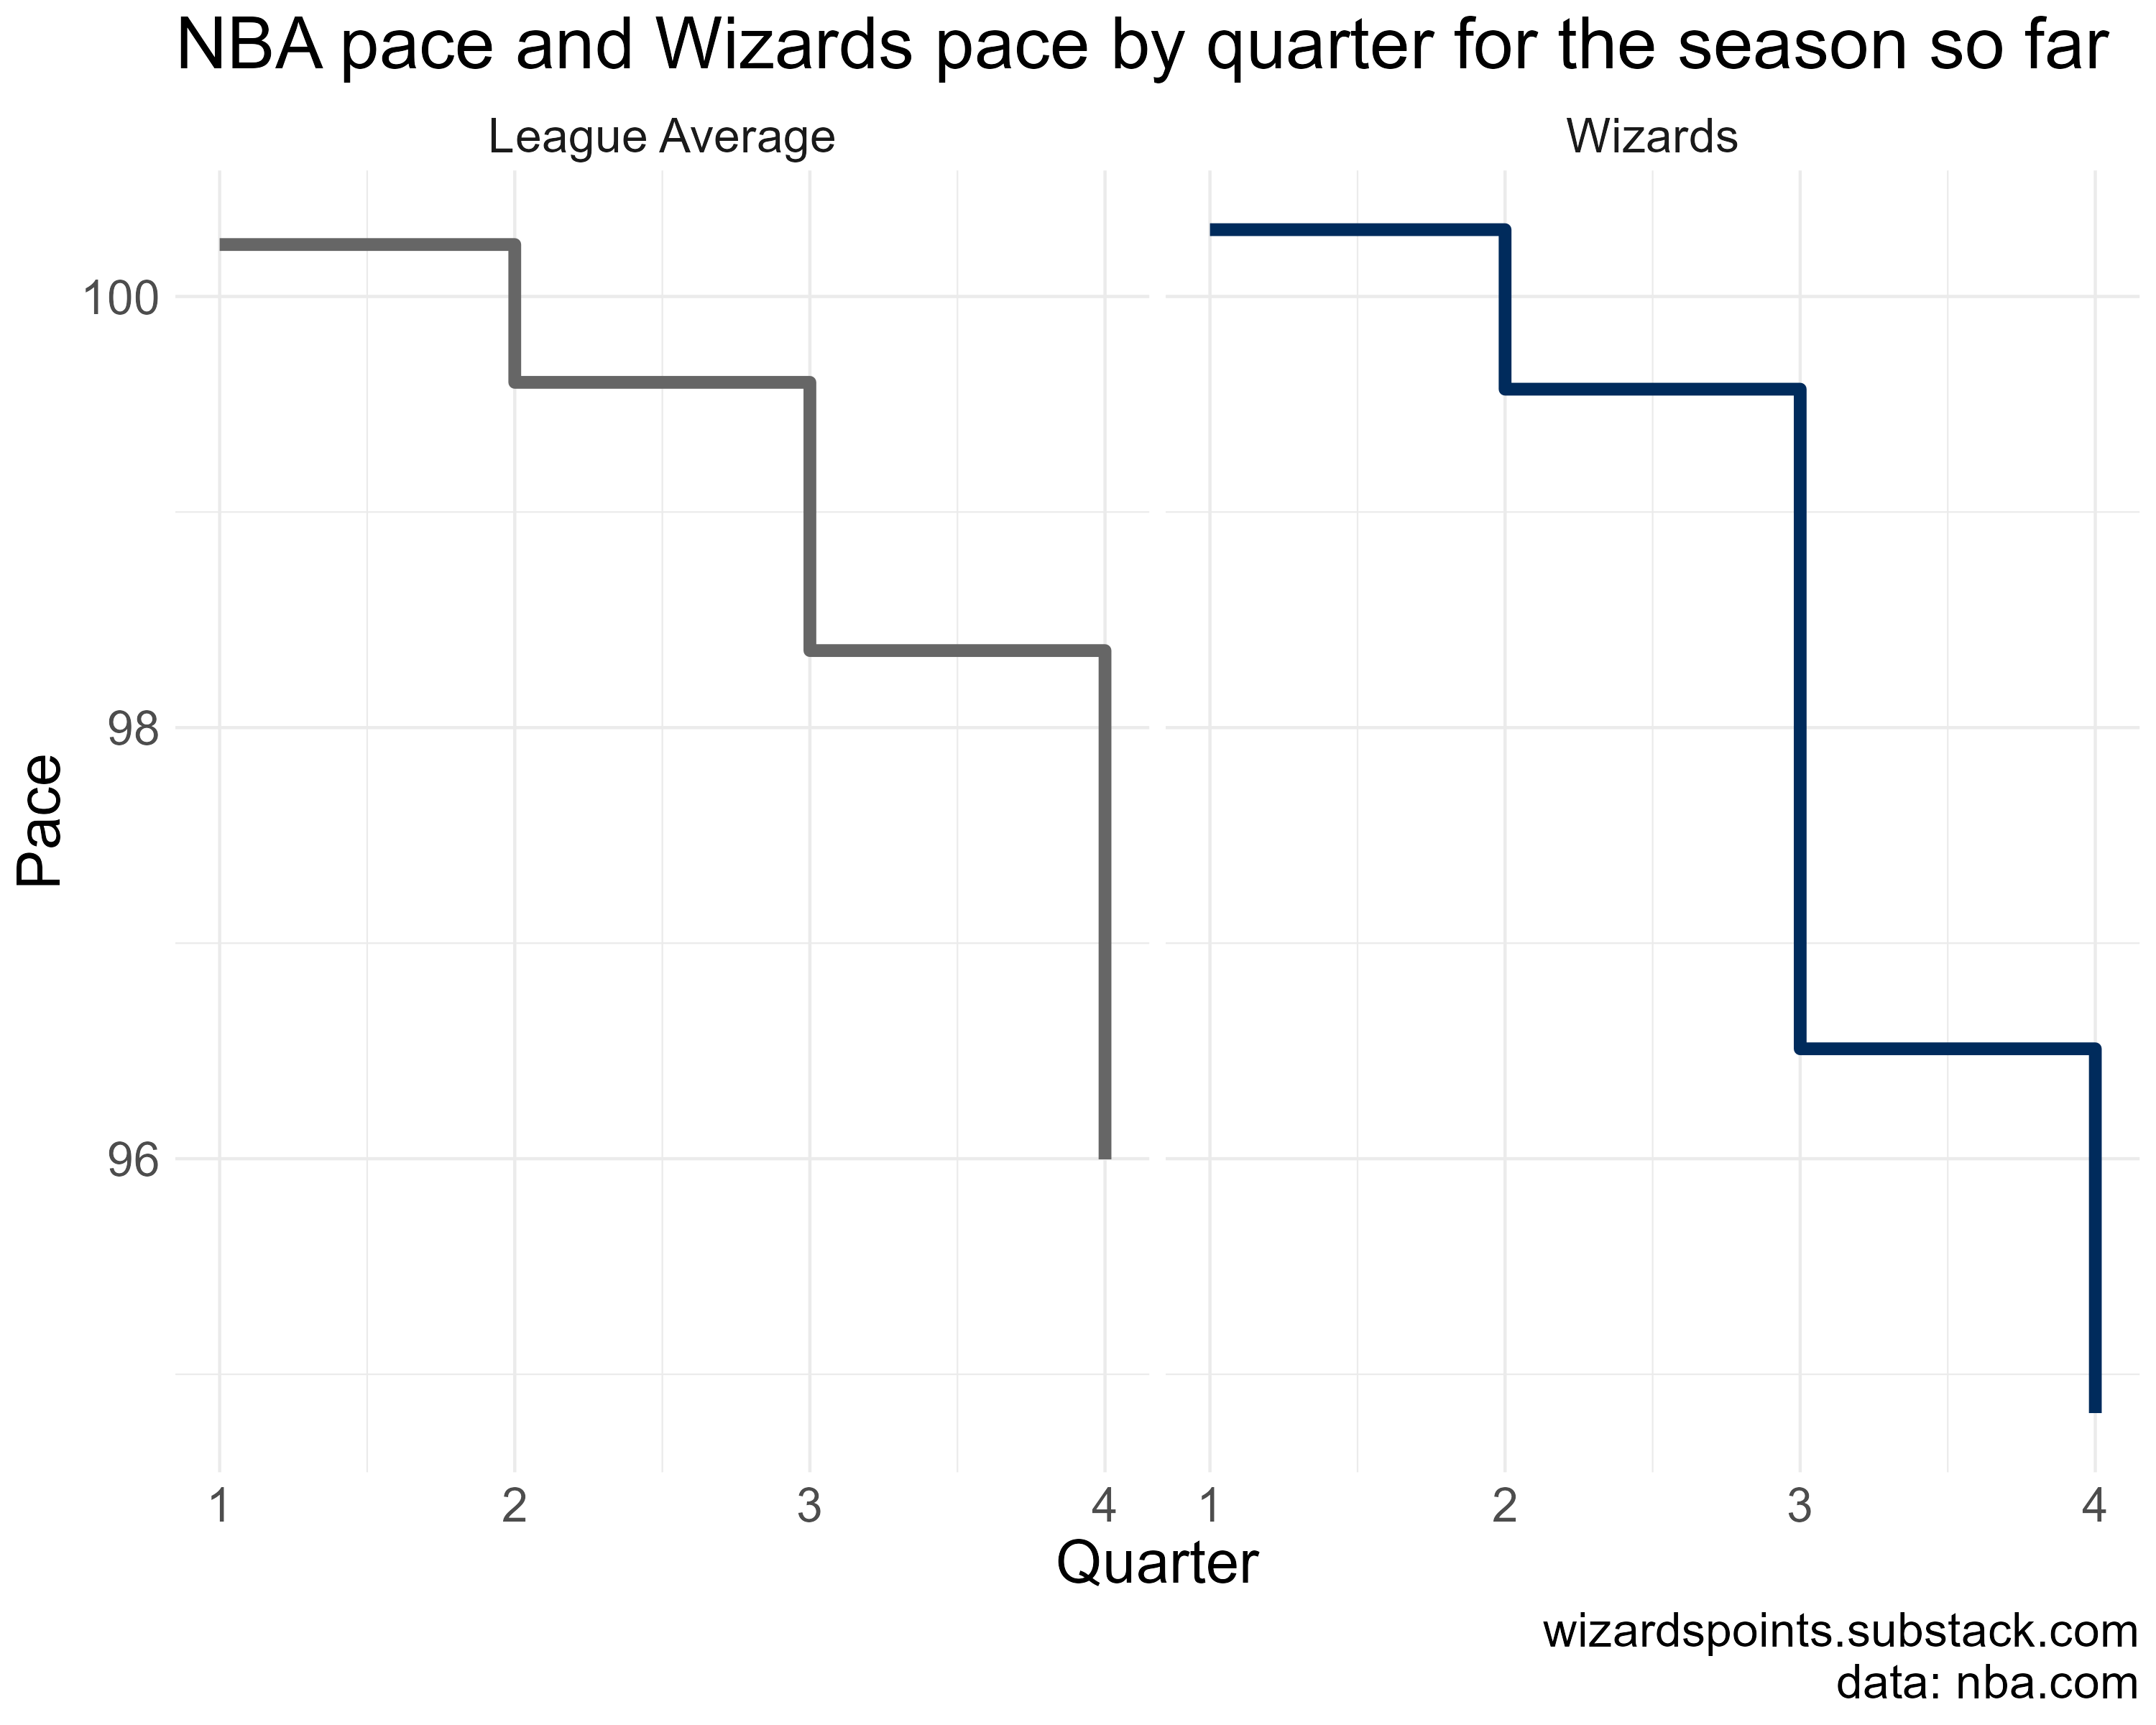
Every season ebbs and flows. In looking at pace stats, I thought it would be interesting to break the figure above down further by looking at how the Wiz do on a quarter by quarter basis.
The figure below shows that on a quarter-by-quarter basis, the Wizards are pretty average. The pace in Wizards games starts to get lower than average in the third (98.4 average to 96.5 for the Wiz) and fourth (96 to 94.8) quarters. For fans, this is essentially what I would call, “comeback time,” when the Wizards attempt to claw back from mistakes made in the first half or their opponents get more efficient in their play and, I don’t know, catch up from 30 points behind.
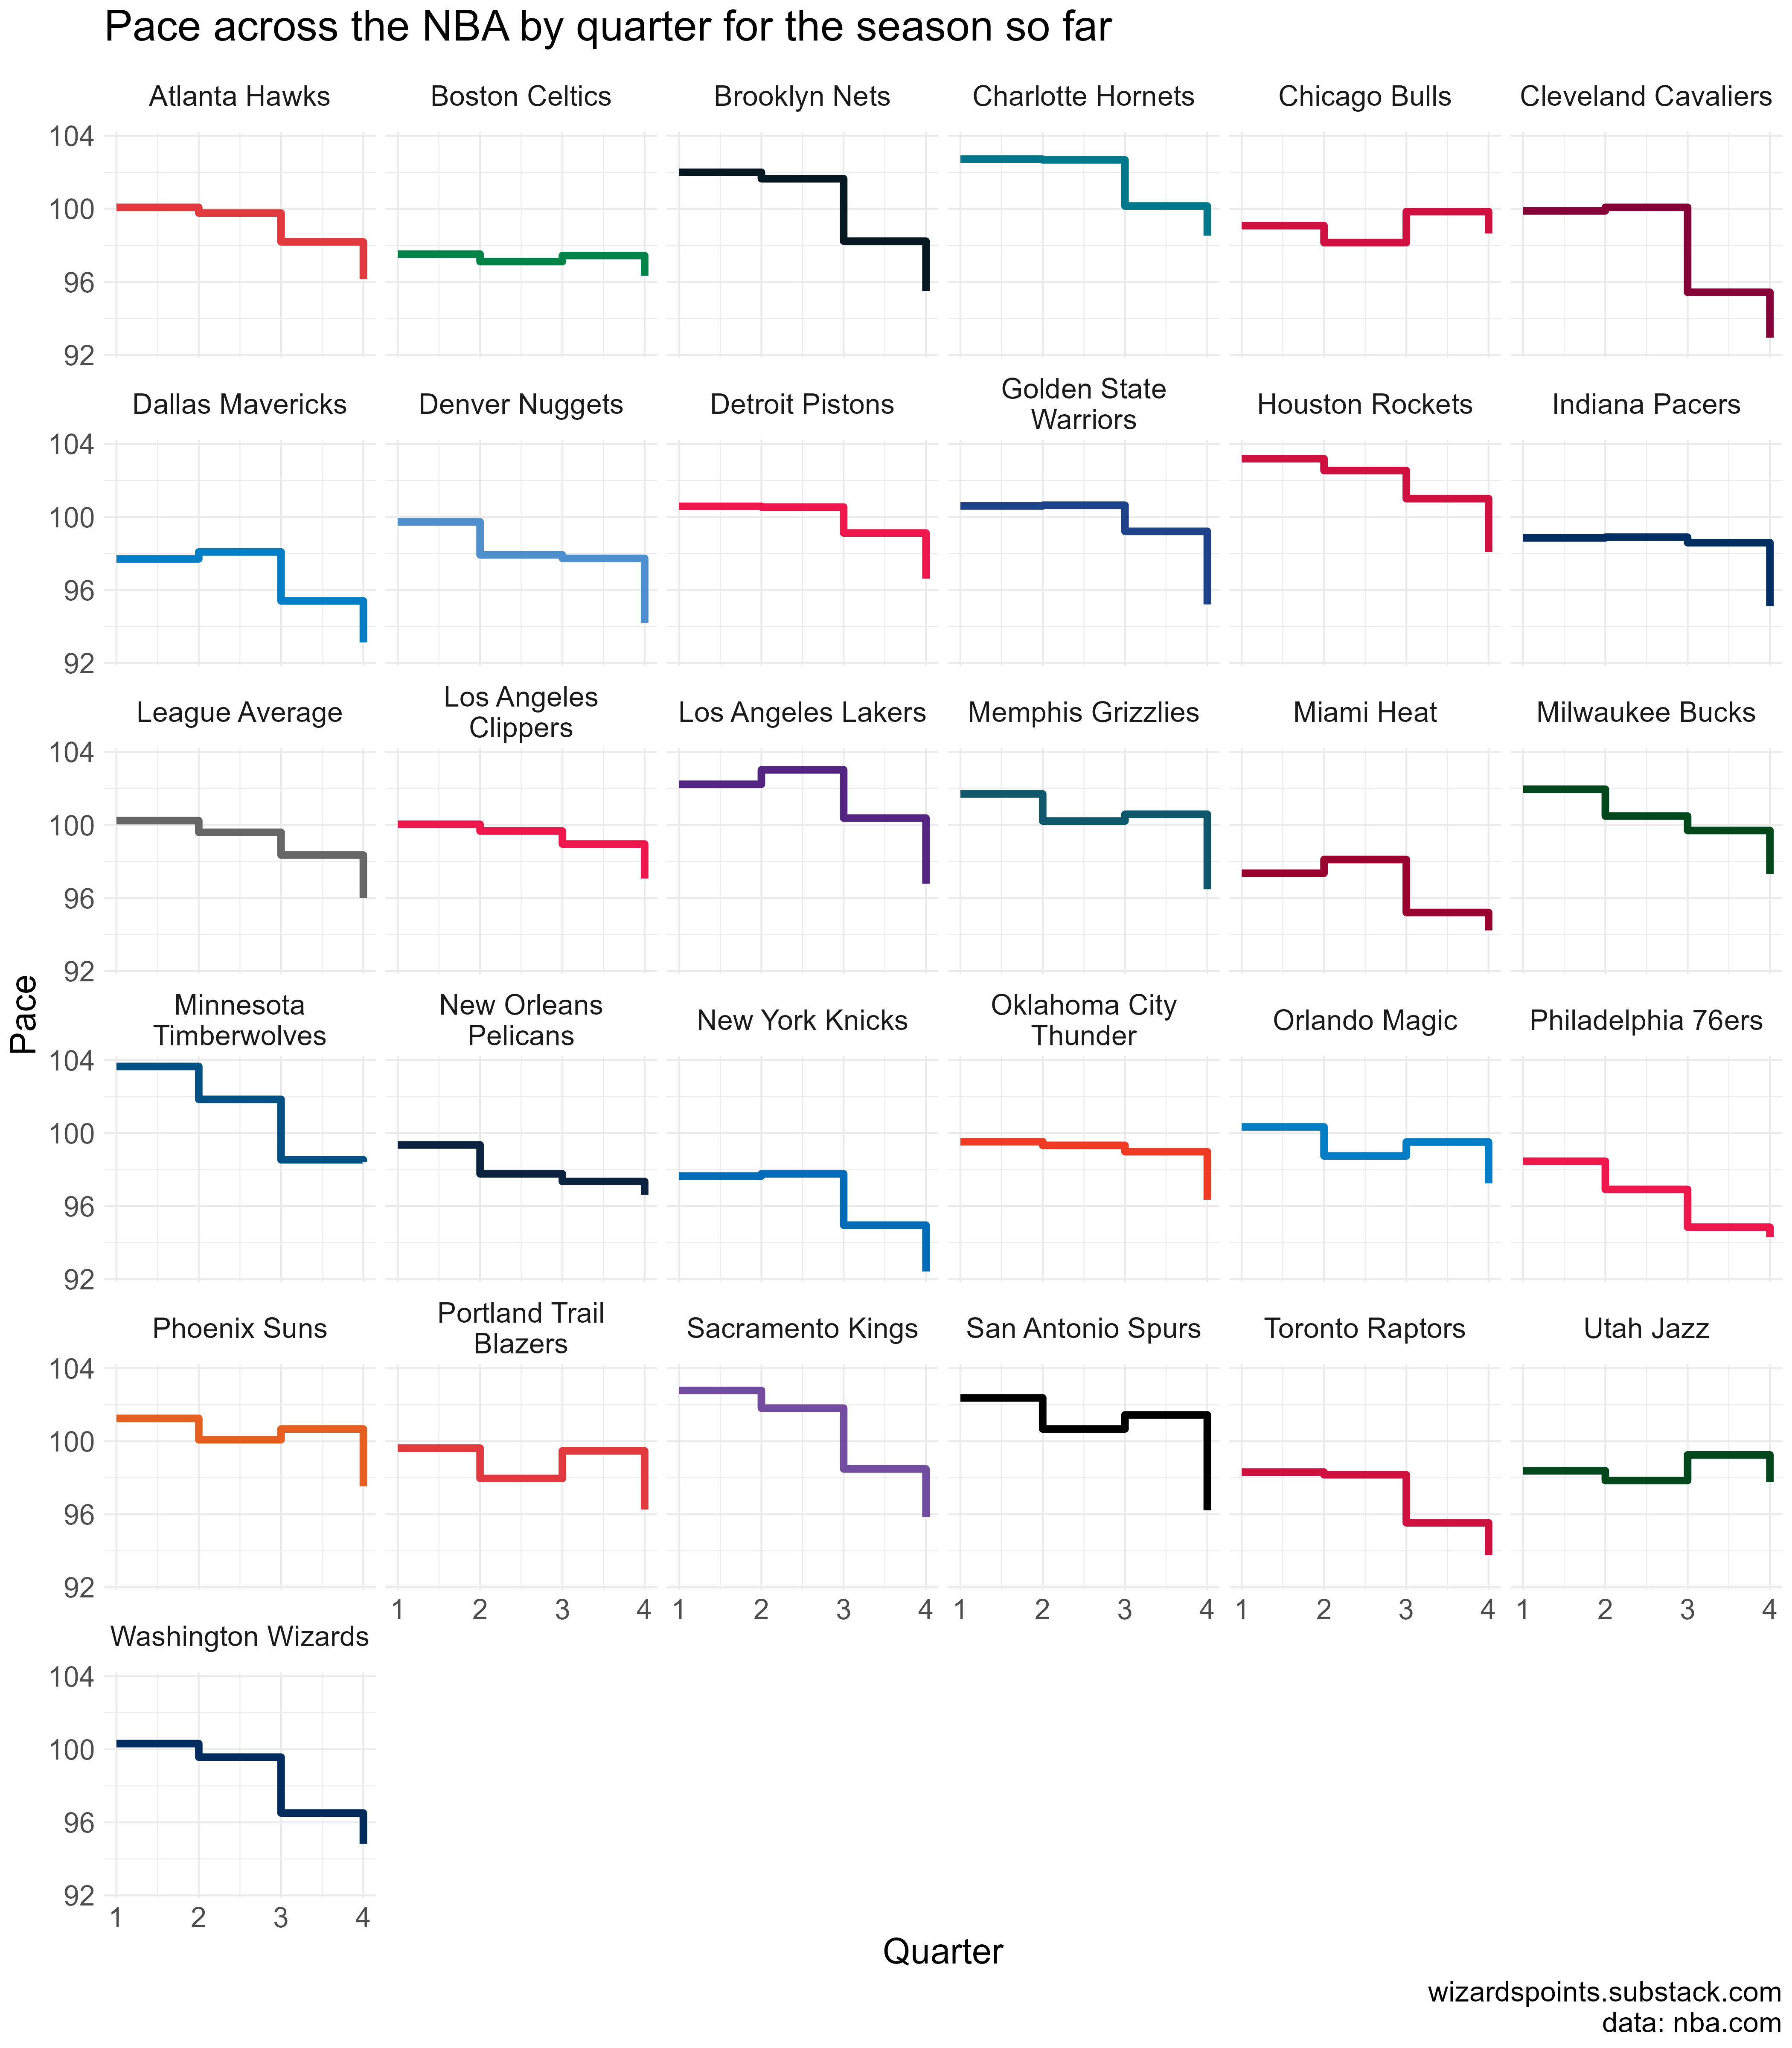
Taking a look at the league as a whole, we can see that teams with a higher pace tend to be younger (Houston), worse overall (Houston), and rebuilding (Houst-, you get the idea). There are obvious exceptions with high pace, highly ranked teams like the Bucks and Grizzlies. Most teams tend to see pace diminish over the course of a game, which makes sense. As you get into the fourth quarter, each possession becomes more important. Weirdly, Utah tends to end games with a notably higher than average pace, while Boston is pretty steady overall.
A positive spin
In thinking about who the Wizards are as a team, ranking toward the bottom 10 teams in pace gives a partial picture. Like a lot of stats, just looking at pace in isolation doesn’t necessarily give you insight into why the team is struggling. Yet, I think it is helpful to see how pace varies across the league within games. Some of the best teams are keeping a steady pace or even increasing possessions as games move into the second half.
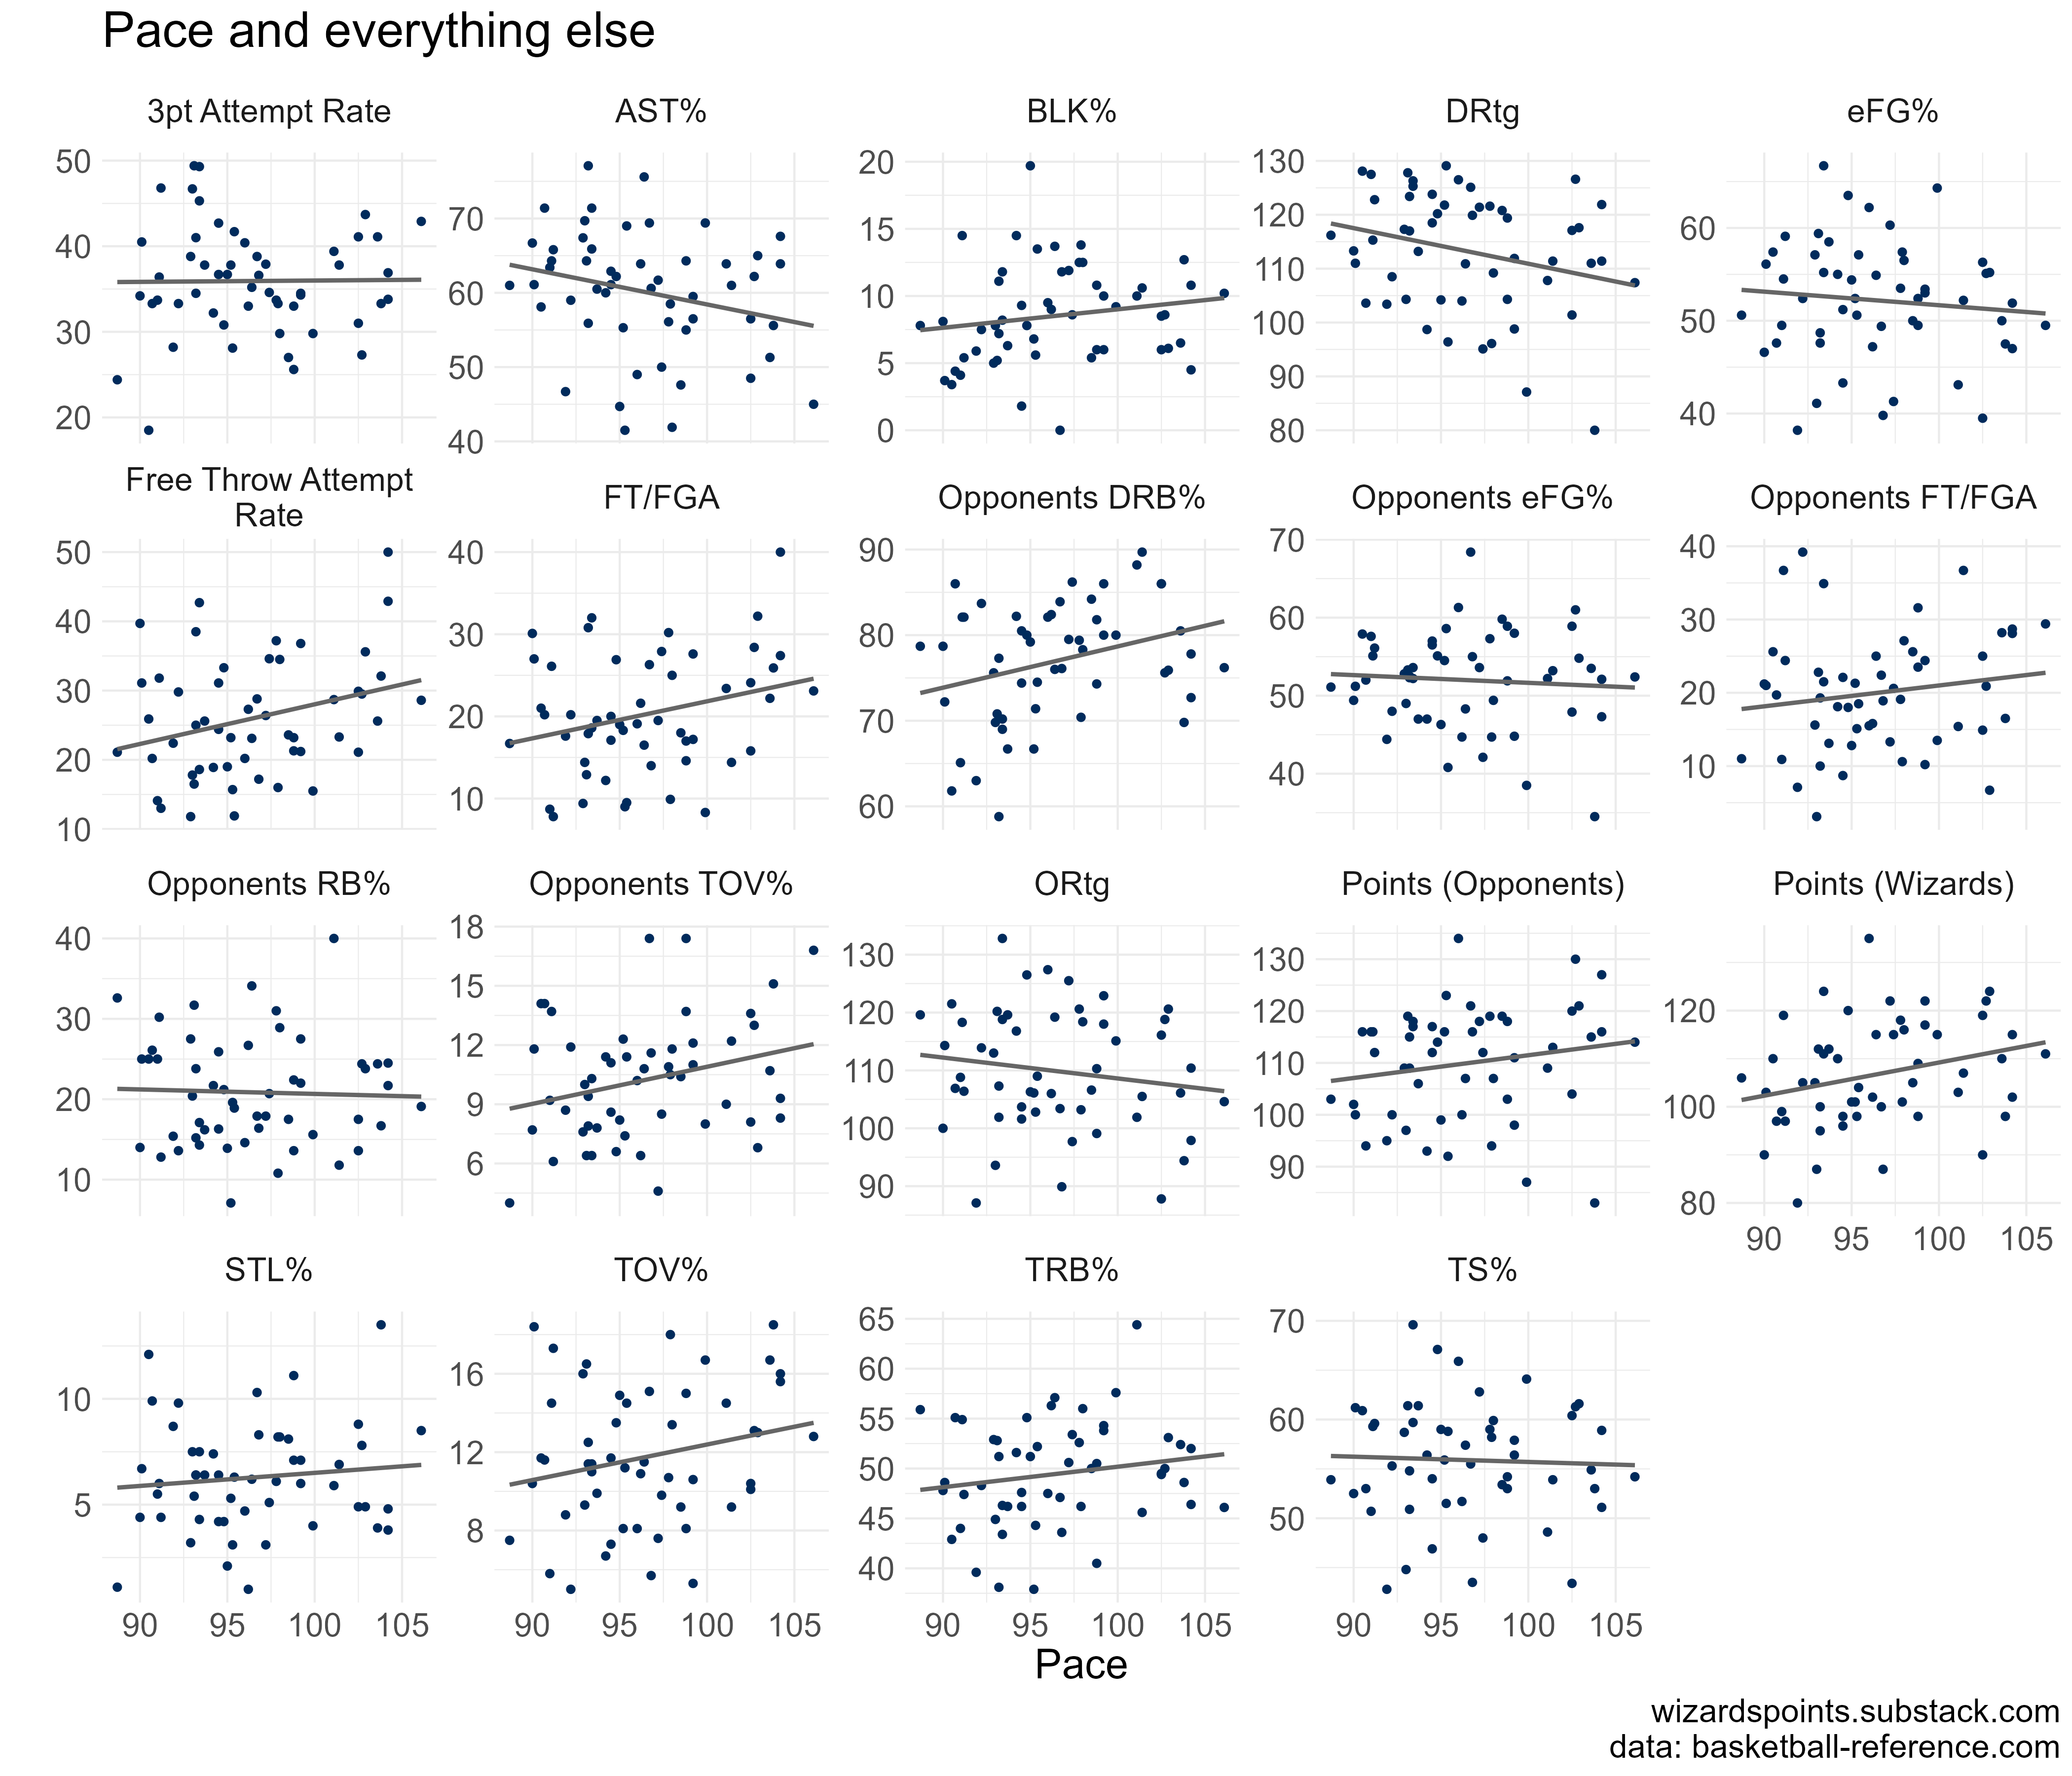
Still, we are a slower paced team. The average age of players with 10 or more games is 26. And this same group take about 8 attempts from the field per game on average. As the Wizards pace increases, so do turnovers (for both the Wizards and opponents) and a higher pace is slightly correlated with a lower defensive rating. The figure below throws a lot at you, but the key thing is if the line is going up, the measure increases as pace increases, if the grey line is going down, the measure goes down as pace increases. Flat lines, like the three point attempt rate, imply a weaker relationship.
Pace tends to be correlated with points, which makes sense—more possessions tend to result in more shots—but doesn’t seem to have much of a relationship with effective field goal percentage or true shooting (i.e., shooting efficiency across all shot types). More possessions may not actually be what the Wizards need as they finish out the season.
I get the whole #soWizards thing. It’s probably my main mode of engaging with the team these days. Winning is fun, but have you ever watched a team try and spectacularly fail to define itself year after year? I also want to push back against my own fatalism and resignation that the hashtag implies. If the only goal was watching a team that is going to win, we may as well just watch the Harlem Globetrotters play the Generals.
I wrote this post—or at least pieces of it and did most of the data work—a few weeks ago.2 I dug into some team stats, but, honestly, there is a lot that is kind of unfortunate. I also was kind of holding out for some big trade news, which seems to finally be coming in as I send this out.
As the mid-season trade deadline comes to a close, it’s worth thinking about how losing Beal and gaining the high pace Ish Smith will change our fortunes. In this post, I wanted to at least provide a reference point for where we have been so far. Seeing what in-game pace looks like around the league provides some examples of how the team might shift its style to make the most of each possession. The trade season has been mild and wild, but now we know where we have been and where we have to go when it comes to pace.
Gonna miss him.
Great analysis as always