
Mapping out the Wizards Landscape

There’s a specific kind of seasonal cold that is more annoying than anything else. You’re too sick to do much, but not sick enough to really call out from work and sit in bed all day. There’s no set time period for how long these illnesses last. There’s not really even a name, so you just say, “I have a cold.” And then you end up saying, “I have a cold” for two weeks while you sit at home mindlessly staring at your phone, going through tissue after tissue.
While in this state over the past week, I noticed a lot of people sharing this graph from ESPN’s Kirk Goldsberry yesterday:


I always like these figures because they are about as close as you can get to checking general NBA vibes. The vibes in Brooklyn are good. Houston is still doing its Houston thing. And then there’s the Wizards.
The team has won 6 of their last 11 games (I’m adding a game to the Goldsberry count) and they have won by an average of 14 points in those six wins. They have had two blow out wins, one against the Suns and one against the Bucks, but…there’s no but here, the Wizards have just won by double digits in four of their last six wins. Yes, teams aren’t playing their best guys and the Wizards have faced injury riddled rosters. No, this doesn’t mean the wins come with an asterisk.
The Goldsberry figure captures this situation well. Efficiency stats, usually defensive and offensive rating, just capture the number of baskets made/allowed per 100 possession, or basically how good was a team/player at scoring when they had the chance to score/allow the other guy to score? But sitting in bed, looking at this, I thought it seemed kind of off.
Even after last night’s loss to the Oklahoma City Puppies,1 the Wizards are ranked third in defensive rating and are now 19th in offensive rating over the past 11 games per NBA.com. So who is driving the team’s possession efficiency?
The Wizards Landscape
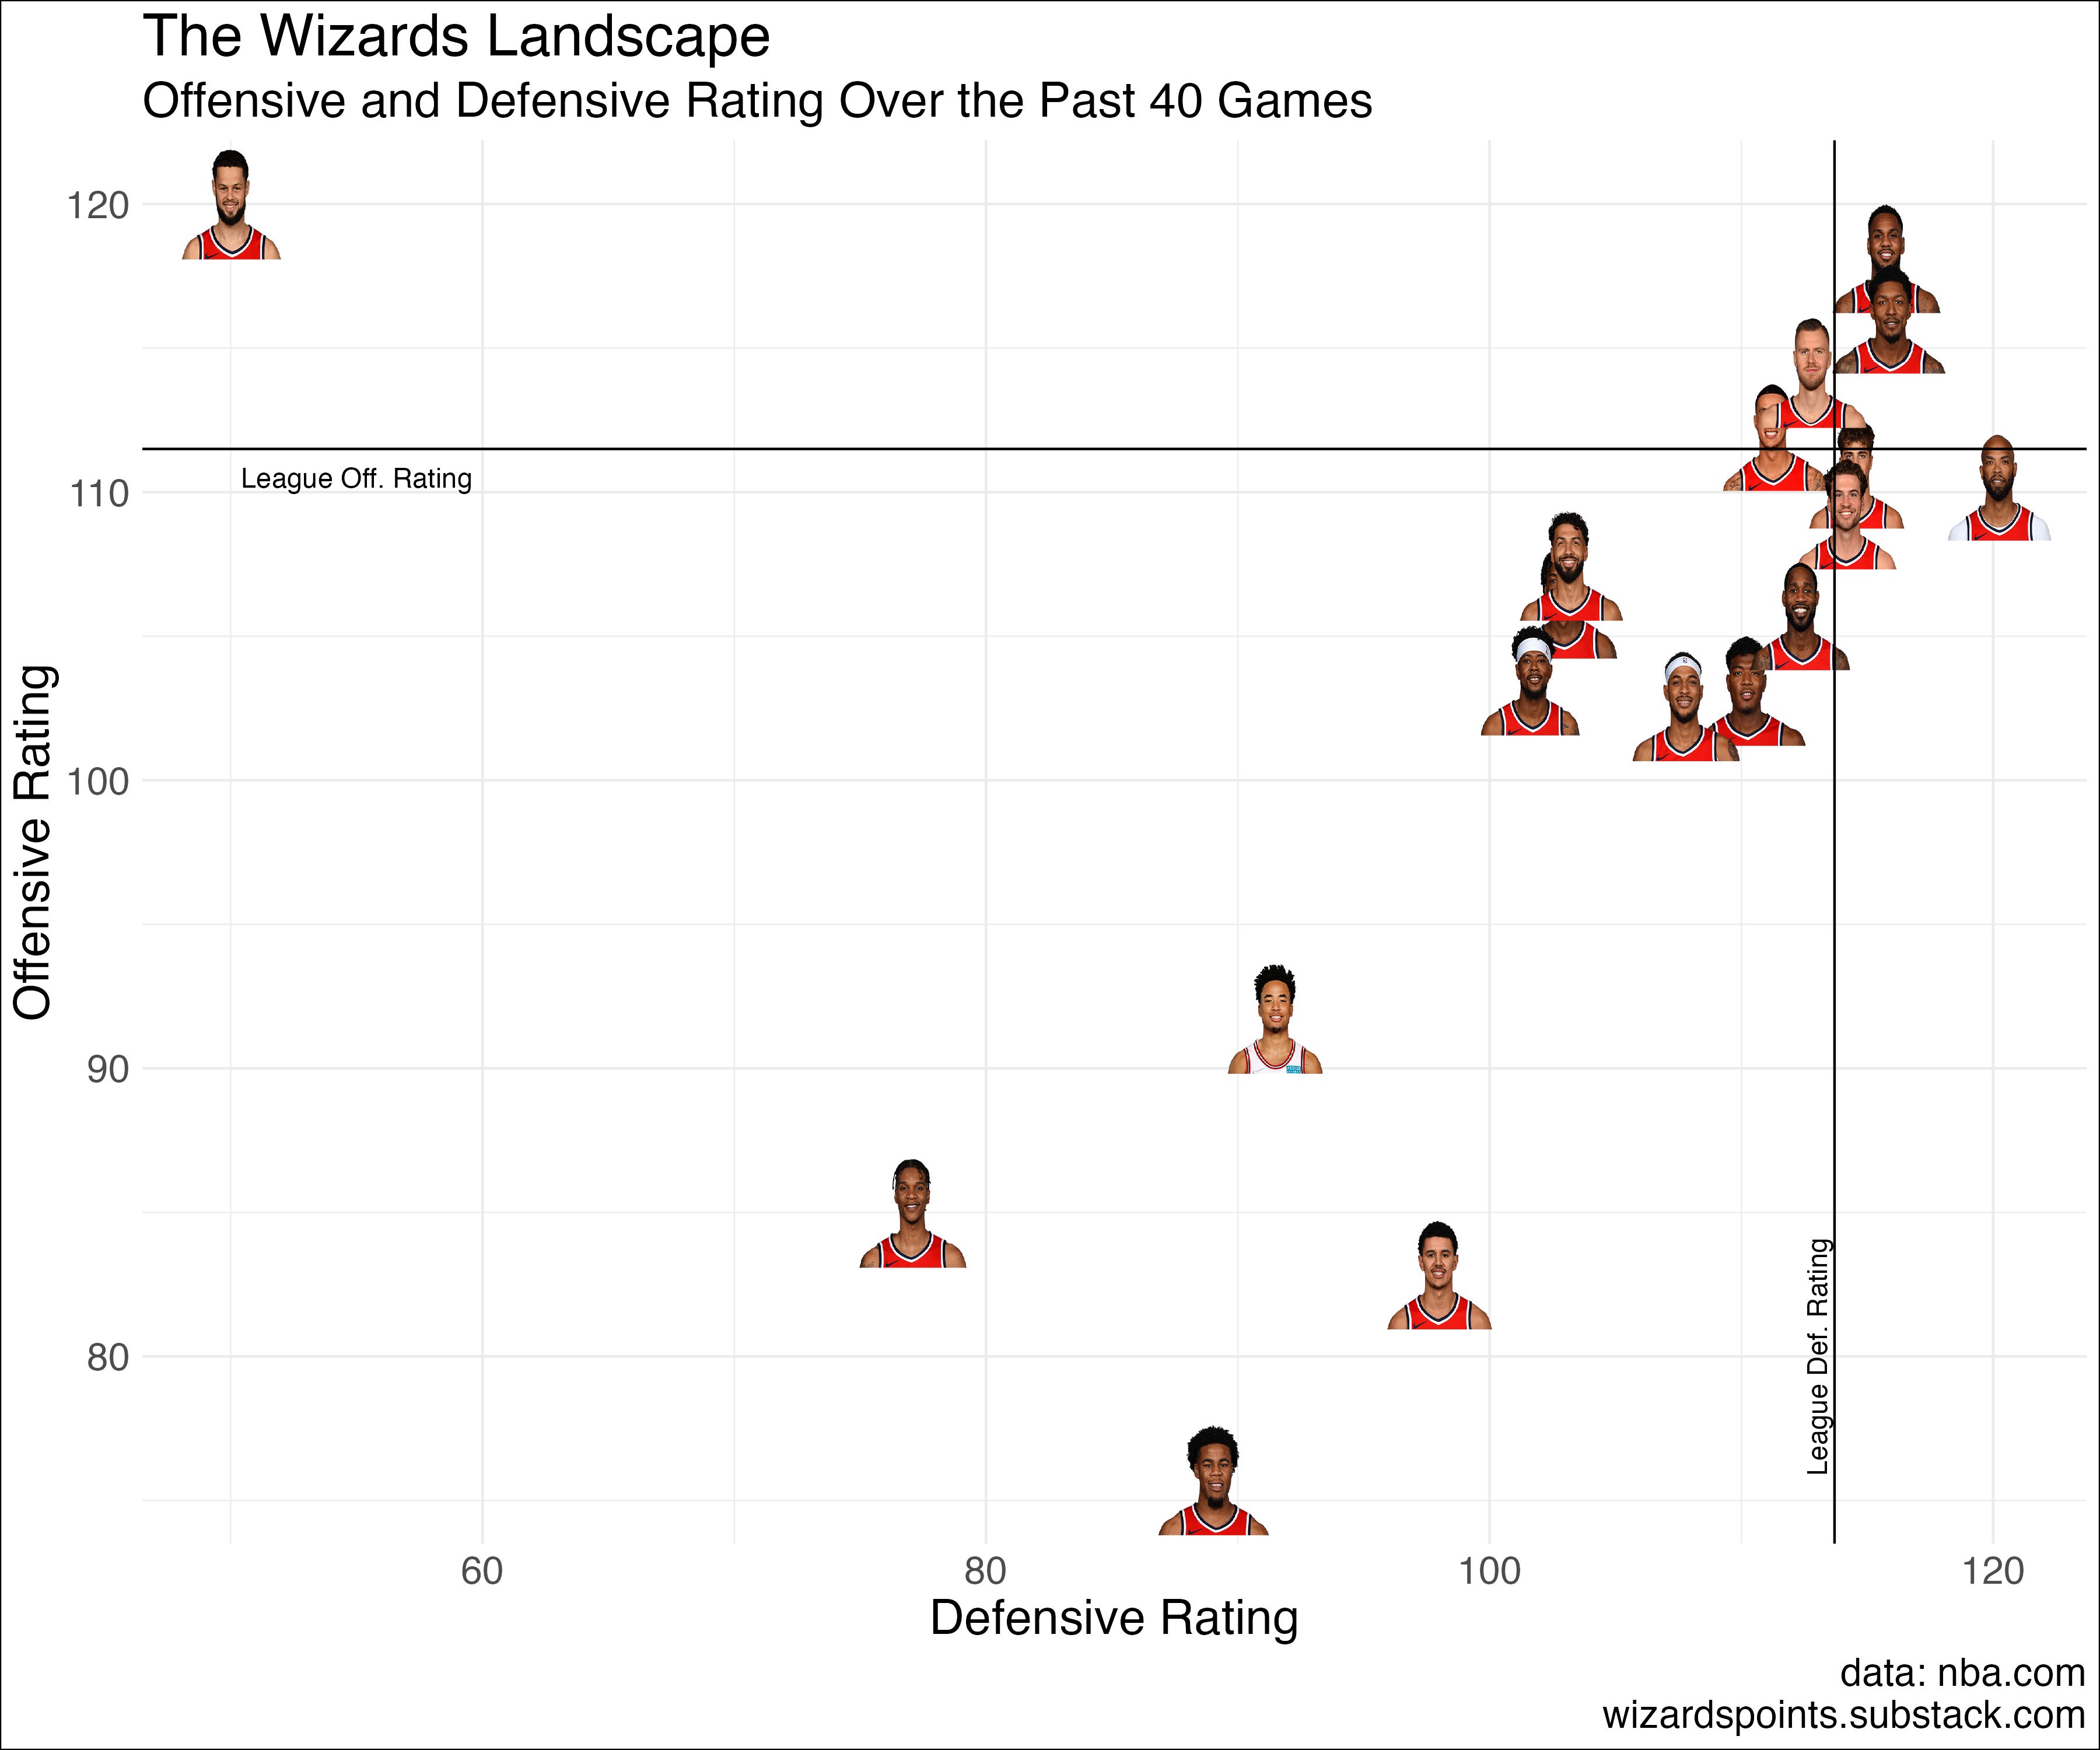
Over the past 11 games the Wizards as a team have had a net rating of 3.7, meaning they are scoring almost four points more than they are allowing per 100 possessions. This is good. Getting more points than the other team scores has always been a struggle for the Wizards, but no matter who is coaching or playing it’s still the most reliable way to win.
In the figure below, we can see that the recently injured Taj Gibson is the most efficient player on the Wizards. Taj has averaged 14.1 minutes over the last six games he has played in (four wins, two losses) but he made the most of that time. On the opposite end of the spectrum, we can see Anthony Gill, Vernon Carey Jr., and Johnny Davis. If you’ve never seen the guy in the top left, that’s fine. I’m not sure he’s even wearing a Wizards jersey in his headshot, and I’m not sure we’ll ever see him again—he has a notable defensive rating of 0.0.2 These guys get too few minutes to really make per 100 stats make any sense at this point in the season.

The main take away to me is that over the last 11 games, the Wizards, especially the starters, have played above average offense, and about average/below average defense. I guess this tracks, but it’s hard to shake seeing Kuzma and Deni miscommunicate while bringing the ball up and then say, “well, the numbers show these are above average dudes” (in fairness, Deni has a below average offensive and defensive rating over the last 11). And there have been some great moments on the court and on the court’s mic that are worth keeping in mind even if some of the less than stellar play is what lingers on the mind after a game.
Of course, the last 11 games are not the full season. Even if the vibes from the figure above seem more or less right, there's more to the story. When we zoom out, not only does Jordan Schakel make a cameo, but Deni Avdija’s above average defense comes into the focus and players are more or less where you might assume they would be based on the eye test.3
But even this doesn’t quite capture things accurately because overall usage, which is a major driver of defensive and offensive efficiency, isn’t really depicted.4
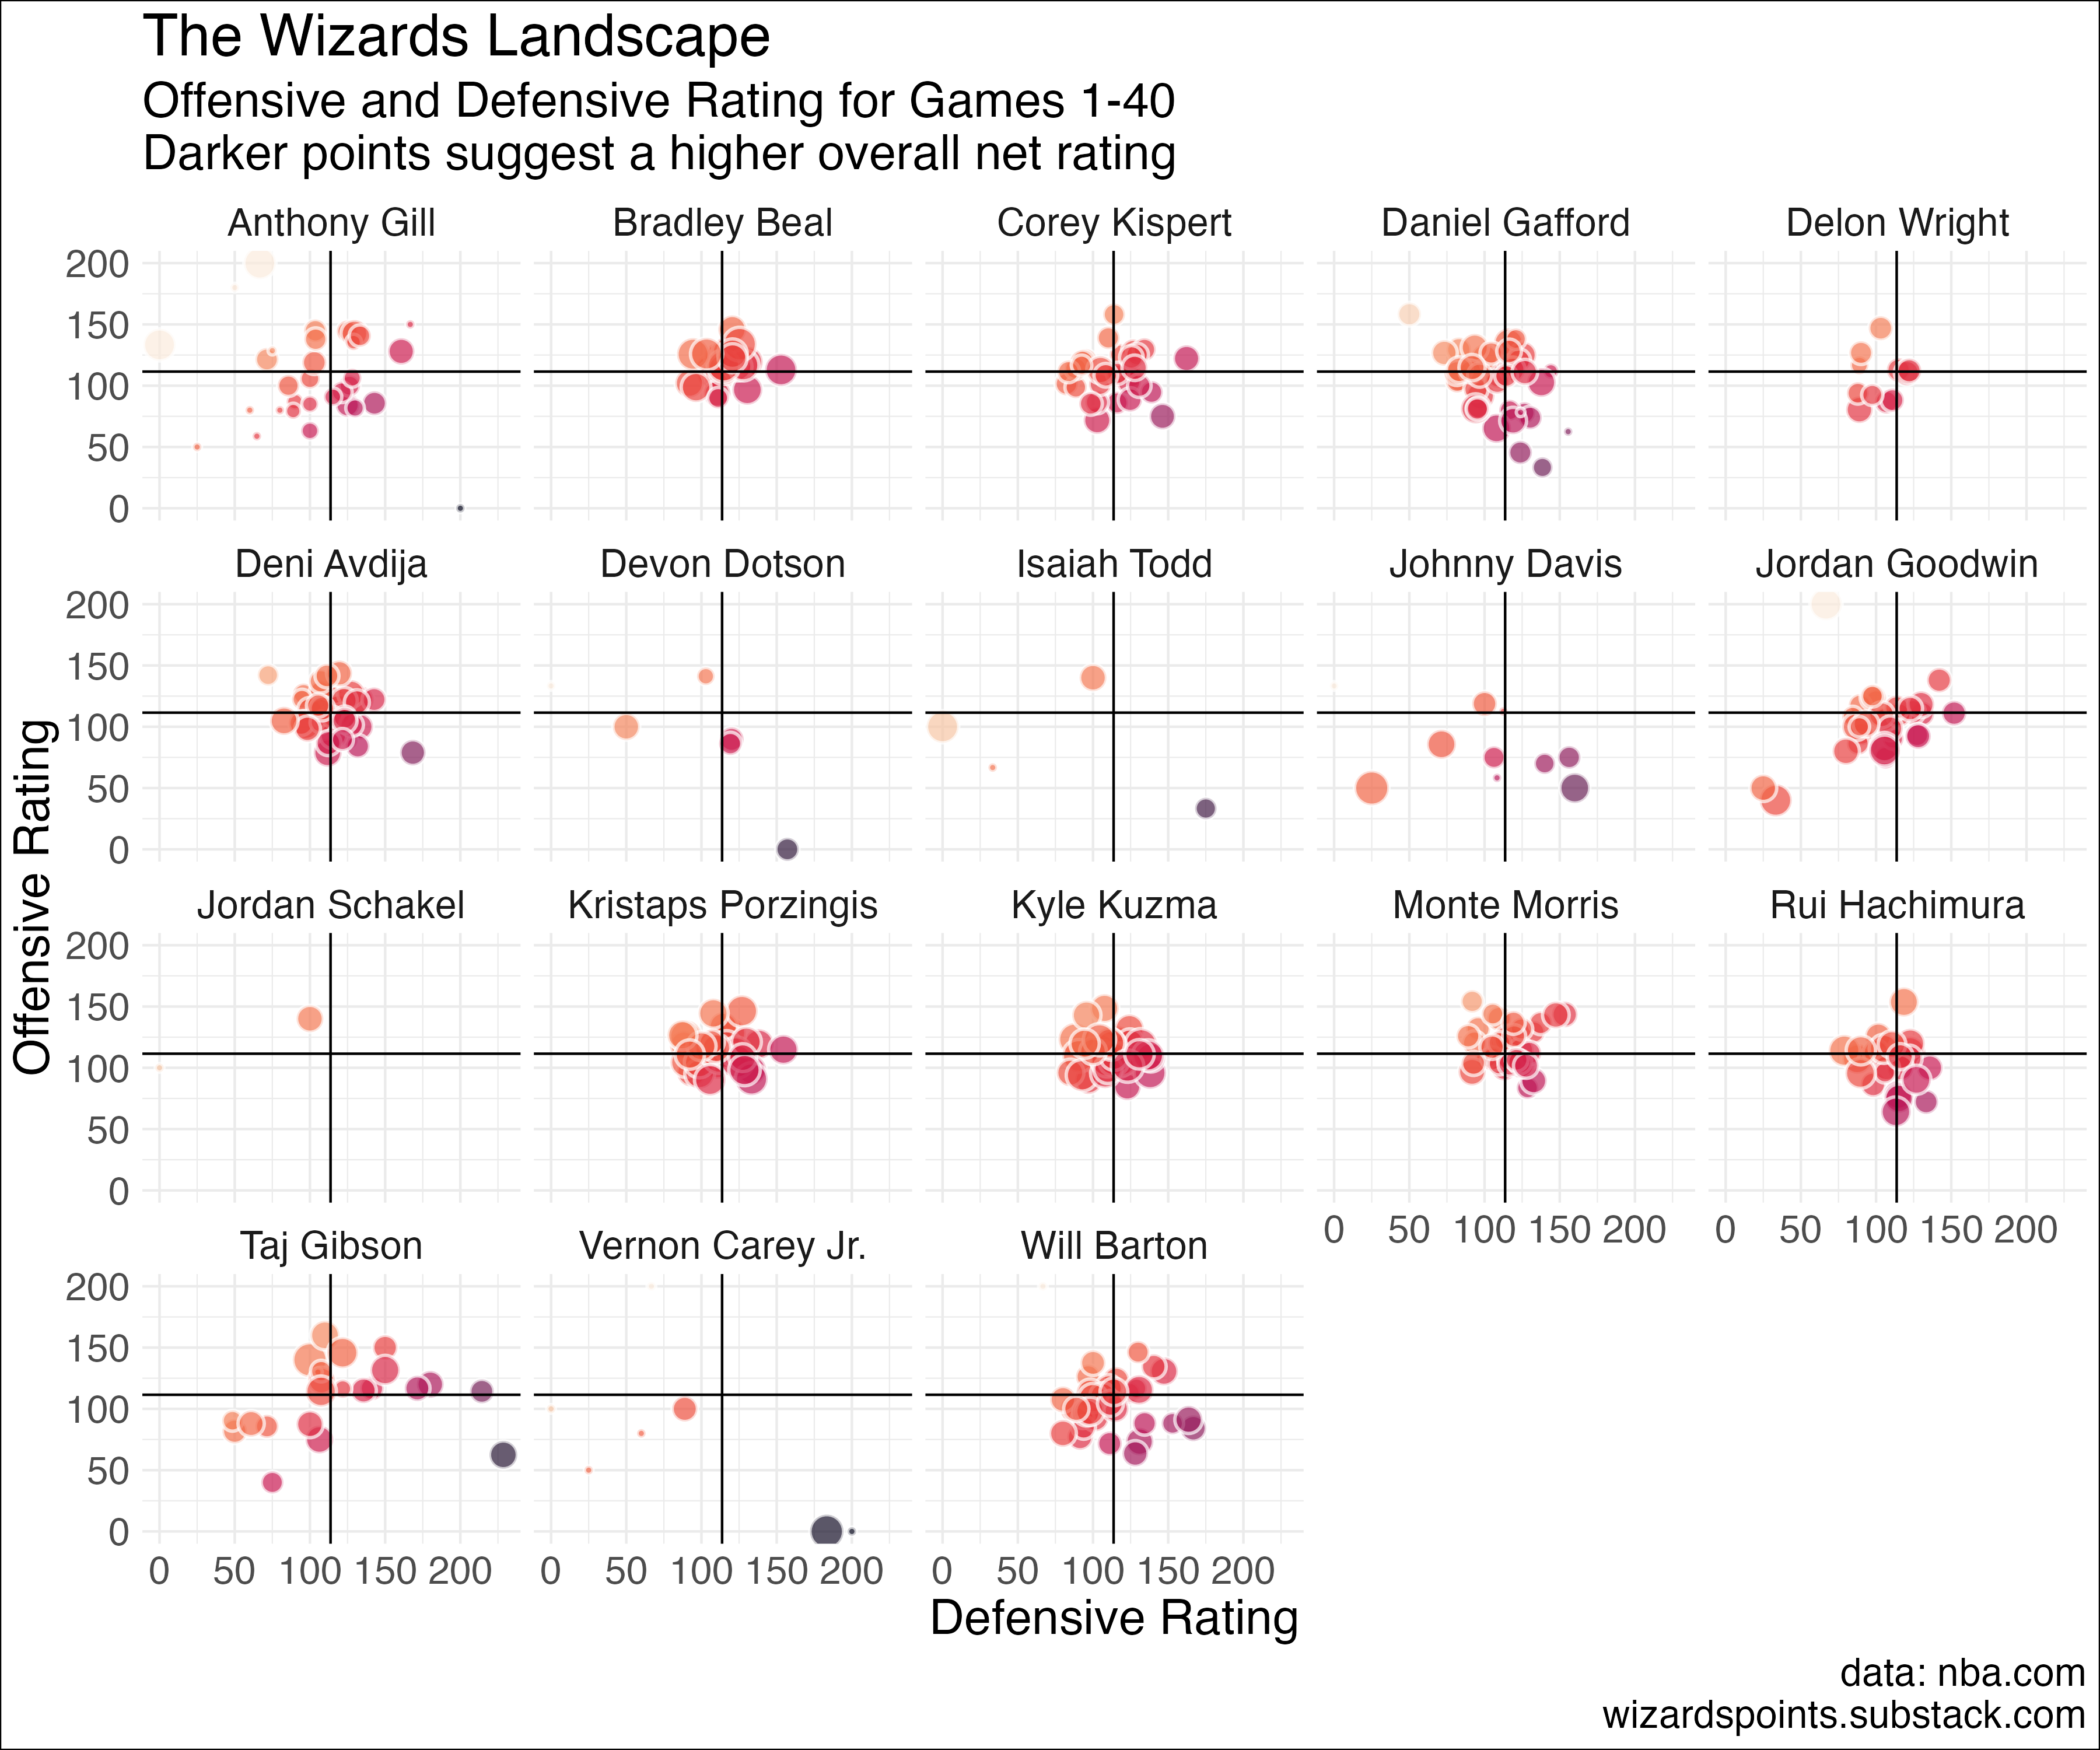
So what would a full season of a player version of the Goldsberry graph look like while accounting for usage? Here’s what I have. Darker points suggest a higher net rating (i.e., offensive rating-defensive rating, or how a guy did overall) and the points are sized by usage per 100 possessions. You can see Jordan Goodwin still tends to have lower than average numbers BUT most of his dots are darker suggesting a net positive rating overall. Beal’s consistency is also very clear while Taj Gibson’s breakout nights are actually better than I would have guessed in his limited minutes.
Wizards Points has featured offensive and defensive rating before. It’s a flawed stat that I can’t seem to look away from. The reason the Goldsberry graph, and offensive/defensive rating, are so alluring is they really point to a general sense of things that tends to track with what you might expect while still having some surprises (the Knicks are not terrible?! Go figure). Maybe it’s the fact that the Wizards have never been a reliable team in my lifetime. Maybe it’s the runny nose. Maybe it’s just a need to be more of a glass half-full type of person. Whatever it is, I was too skeptical when I first saw the graph. What is fandom if not a form of benign optimism? As we hit the half-way mark on the season this is a reminder to suspend disbelief, or at least give in to being a little unrealistic. If the Wizards can lose to OKC by 17, maybe they can beat the Magic by 10 and keep things interesting against the Warriors. The landscape is not exactly unknown, but it’s not clearly mapped out either.
I’m only making fun of how young OKC is because I wish the Wizards were as smart about rebuilding as the Thunder’s draft pick hoarding management team.
It’s Devon Dotson, who was clearly eager to make a splash coming in from the G-League, but given his size, probably won’t be breaking into the rotation much.
Actually, I would have guessed Rui would be a little higher on offensive rating for the season so far